-
A
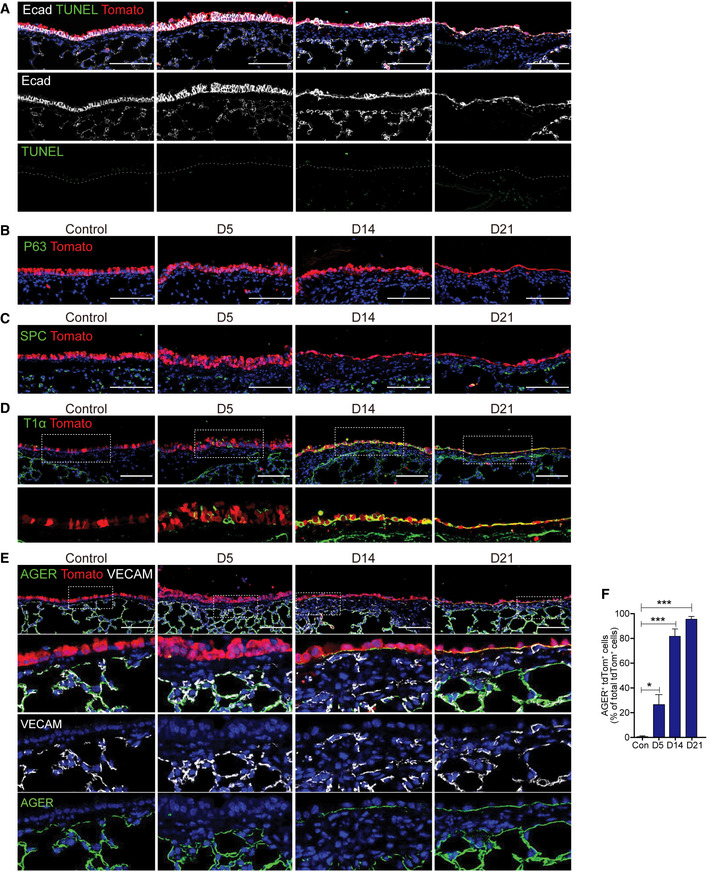
Representative IF images showing the expression of epithelial cell marker E‐cadherin and apoptosis marker TUNEL in Scgb1a1 lineage‐labeled tdTomato+ cells of control and Lats1/2 dKO lungs. Tomato (for secretory lineage, red), E‐cadherin (for epithelial cell, white), TUNEL (for apoptotic cells, green), and DAPI (blue). Scale bars, 100 μm.
-
B
Representative IF images showing the expression of basal cell marker P63 in Scgb1a1 lineage‐labeled tdTomato+ cells in control and Lats1/2 dKO lungs. Tomato (for secretory lineage, red), P63 (green), and DAPI (blue). Scale bars, 100 μm.
-
C
Representative IF images showing the expression of AT2 cell marker SPC in Scgb1a1 lineage‐labeled tdTomato+ cells in control and Lats1/2 dKO lungs. Tomato (for secretory lineage, red), SPC (green), and DAPI (blue). Scale bars, 100 μm.
-
D, E
Representative IF images showing the expression of AT1 cell markers T1α (D), AGER (E), and endothelial marker VECAM (E) in Scgb1a1 lineage‐labeled tdTomato+ cells in control and Lats1/2 dKO lungs. Tomato (for secretory lineage, red), T1α (D, green), AGER (E, green), VECAM (E, white), and DAPI (blue). Scale bars, 100 μm.
-
F
Quantification of Scgb1a1 lineage‐labeled tdTomato+AGER+ AT1 cells in (E). Data are presented as mean ± SEM (n = 5 mice for each group). *P < 0.05, ***P < 0.001 (Student’s t‐test).

