-
A
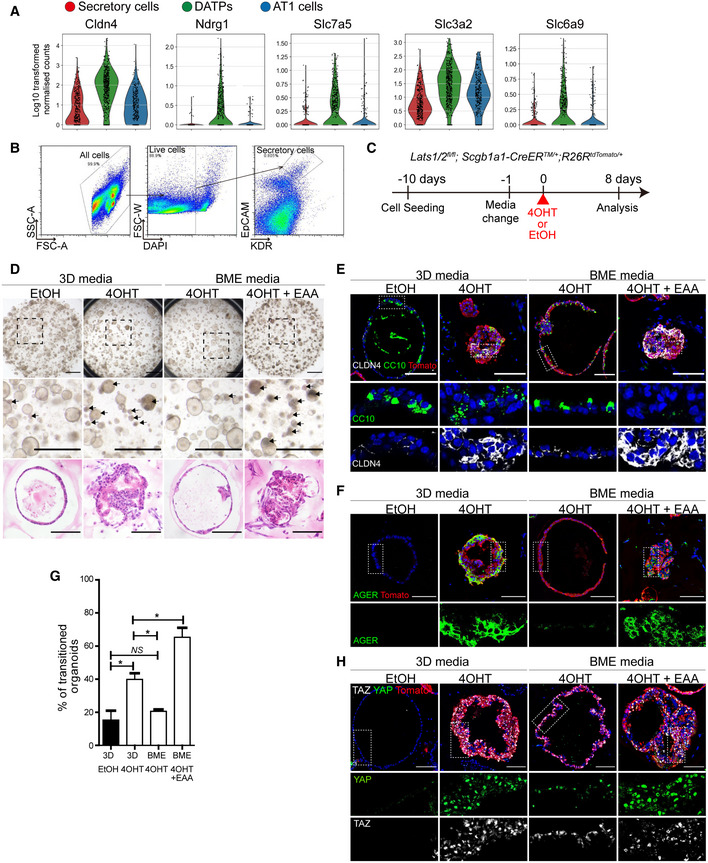
Violin plots of DATP markers (Cldn4, Ndrg1) and EAA transporters (Slc7a5, Slc3a2, Slc6a9) in control and Lats1/2 dKO lung cells at day 5 post tamoxifen treatment.
-
B, C
Flow cytometry sorting scheme for isolation of secretory cells (EpCAM+KDR+) (B) and experimental designs for organoid cultures (C). Secretory cells were isolated from unlabeled Lats1/2 dKO lungs, followed by 3D organoid cocultures with stromal cells. 3D normal media was changed to experimental media 1 day prior to 4‐hydroxytamoxifen (4‐OHT) or ethanol (EtOH) treatment. Organoids were analyzed at day 8 post 4‐OHT or EtOH treatment.
-
D
Representative brightfield and H&E images of 3D organoids. Arrow indicates transitioned 3D organoids retaining DATPs and AT1 cells. Scale bars, 1 mm for brightfield images, 200 μm for H&E images.
-
E, F
Representative IF images of secretory, DATPs, or AT1 cells in secretory organoids in indicated culture conditions. Tomato (for Scgb1a1 lineage, red), CC10 (E, green), CLDN4 (E, white), AGER (F, green), and DAPI (blue). Scale bars, 100 μm.
-
G
Quantification of transitioned 3D organoids in 3D normal media (3D), amino acid‐limited Basal MEM media (BME), or affluent repletion of EAA in BME media (BME+EAA) with 4‐OHT or EtOH treatment. Data are presented as mean ± SEM (n = 3 technical replicates per group). *P < 0.05, NS, not significant (Student’s t‐test).
-
H
Representative IF images of YAP and TAZ expression of secretory organoids in indicated culture conditions. Tomato (for Scgb1a1 lineage, red), YAP (green), TAZ (white), and DAPI (blue). Scale bars, 100 μm.

