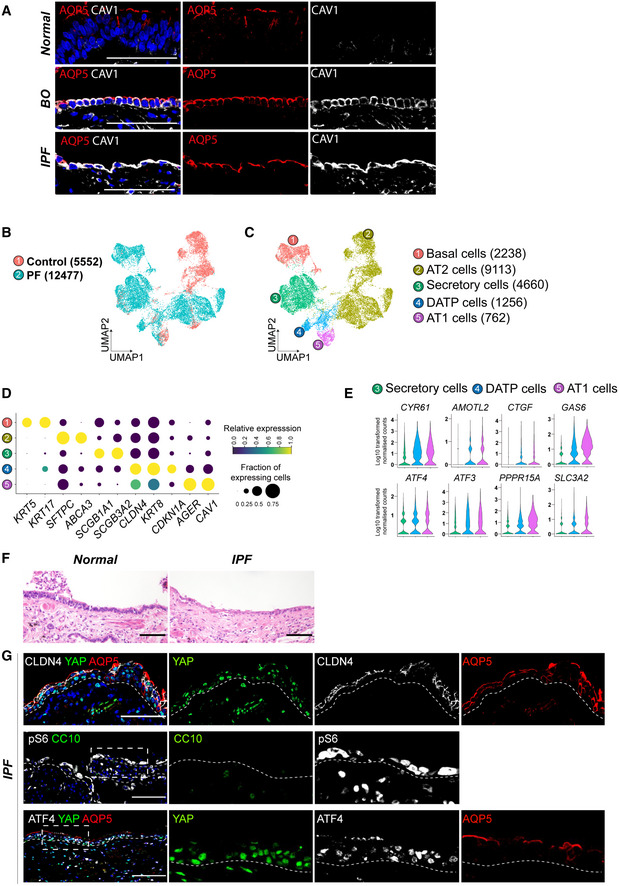
Representative IF images showing the expressions of AT1 cell marker AQP5 and CAV1 in the airways of normal background (top), IPF (middle), and BO (bottom) human lungs. AQP5 (red), CAV1 (white), and DAPI (blue). Scale bars, 100 μm.
UMAP plot showing single cells from normal background (control, 5552) and pulmonary fibrosis (PF, 12477) of human lung tissues (
GSE135893).
UMAP plot representing 5 color‐coded cell clusters identified in merged single‐cell transcriptomes from control and PF lungs.
Blob plot depicting selected marker genes in each cell cluster. Dot size encodes the percentage of cells expressing the genes, and color encodes the average per cell gene expression level.
Violin plots showing normalized expression levels of YAP/TAZ targets (CYR61, AMOTL2, CTGF, GAS6) and mTORC1‐ATF4 targets (ATF4, ATF3, PPPR15A, SLC3A2).
Representative H&E images of human airway from normal background or IPF. Scale bars, 100 μm.
Representative IF images showing the expression of YAP, ATF4, DATP marker CLDN4, AT1 cell marker AQP5, secretory cell marker CC10, and mTORC1 activity marker p‐S6 in human lungs of IPF. YAP (green, top and bottom), ATF4 (white, bottom), CLDN4 (white, top), AQP5 (red, top and bottom), CC10 (green, middle), p‐S6 (white, middle), and DAPI (blue). Scale bars, 100 μm.

