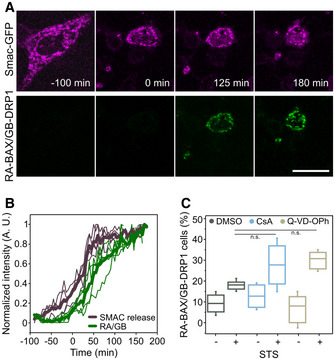
Figure 2. Dynamics of BAX and DRP1 interaction during apoptosis.

- Confocal microscopy time‐series images of the increase in cytosolic Smac‐GFP (magenta) in relation to the detection of RA‐BAX/GB‐DRP1 complexes (green) during apoptosis induction in MEF DRP1 KO cells. Scale bar 10 μm. Images are representative for n = 3 independent experiments.
- Normalized fluorescence intensity of Smac‐GFP in a region of interest in the cytosol and of RA‐BAX/GB‐DRP1 foci for individual cells (thin lines) and the average of all cells (thick lines, n = 5). Time 0 min corresponds to the time point when RA‐BAX/GB‐DRP1 foci were detected.
- Quantification of BAX/DRP1 interaction (% cells with RA‐BAX/GB‐DRP1 foci normalized to the mito‐BFP positive cells, n = 100 cells per experiment) during inhibition of effector caspases (Q‐VD‐OPh), the mitochondrial permeability transition pore (CsA) versus control (DMSO), with or without apoptosis induction (+/− STS). Box plots represent the interquartile (box), median (line) and SD (whiskers). Significance was determined from n = 3 independent experiments (with n = 100 cells each) by paired two‐tailed Student's t‐test (n.s. indicating P > 0.05) compared to DMSO control after apoptotic induction (STS).
