-
A, B
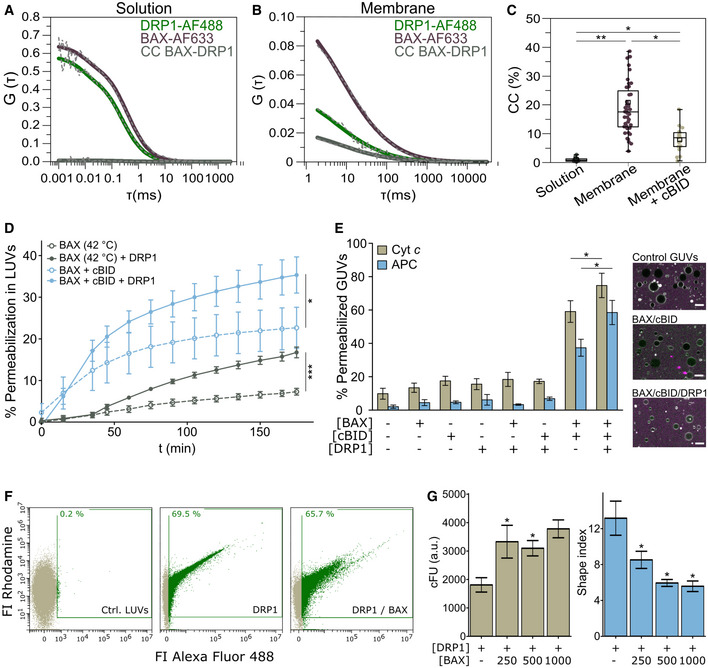
Representative auto‐ (green and violet curves) and cross‐correlation (CC, BAX‐DRP1, grey curves) curves of DRP1‐AF488 and BAX‐AF633 measured by FCCS in solution (A) and in the membrane of GUVs (B). Dash gray line depicts raw data and solid lines correspond to data fitting.
-
C
Quantification of %CC between DRP1‐AF488 and BAX‐AF633 in solution (grey), in the membrane (violet), and in the membrane in presence of excess unlabeled cBID (beige). Box plots represent the interquartile (outer box), mean (inner box), median (line) and range (whiskers). Levels of significance were determined by paired two‐tailed Student's t‐test (*P < 0.05, **P < 0.01) from n = 9 measurements in solution, n = 46 individually measured GUVs in the membrane or n = 17 GUVs in presence of cBID.
-
D
Effect of DRP1 on BAX‐induced LUV permeabilization. BAX was activated by cBID (blue lines), or mild heat (42°C, grey lines). Data are presented as mean ± SD of n = 3 individual experiments. Significance was determined at the end‐point of the kinetic measurement (180 min) by paired two‐tailed Student's t‐test (*P < 0.05, ***P < 0.001).
-
E
Effect of DRP1 on BAX‐induced GUV permeabilization. Left: % GUVs permeabilized to Cytochrome c
488 (Cyt c, 12 kDa, beige) and allophycocianin (APC, 104 kDa, blue) in the absence or presence of cBID, BAX and DRP1 combined as indicated. Data are presented as mean ± SD of n = 4 independent experiments. *P < 0.05 (paired two‐tailed Student's t‐test). Right: representative confocal microscopy images showing GUVs (grey) in a solution of Cyt c (green) and APC (magenta). Scale bar 10 µm.
-
F, G
Effect of BAX on DRP1 membrane density and DRP1‐induced shape alterations of liposomes measured by flow cytometry. (F) Representative flow cytometry plots outlining DRP1 (Alexa Fluor 488 signal) binding to LUVs (Rhodamine signal) in the absence or presence of BAX. % DRP1‐positive LUVs indicated in green. (G) Membrane density of DRP1 (corrected fluorescence units, cFU, left graph) and DRP1‐induced membrane tethering (indicated by a shape index > 1, right graph) in LUVs in the absence or presence of different concentrations of BAX. Data are presented as mean ± SD of n = 3 independent experiments. *P < 0.05 (paired two‐tailed Student's t‐test) vs. DRP1 without BAX.

