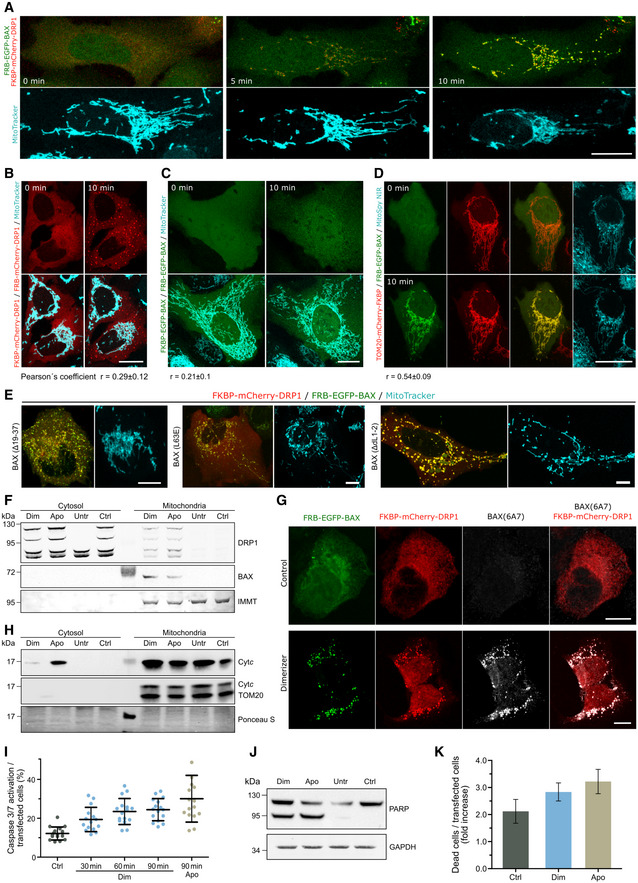
Figure EV5. Induced dimerization of BAX and DRP1 induces apoptosis.

-
AConfocal microscopy of U2OS BAX/BAK DKO cells transfected with FKBP‐mCherry‐DRP1 (red) and FRB‐EGFP‐BAX (green) and stained with MitoTracker Deep Red FM (cyan). Images were acquired before (0 min) and after induction of BAX/DRP1 dimerization (5, 10 min). Scale bar 20 µm.
-
B–DInduced dimerization of DRP1 to itself (B), BAX to itself (C) or BAX to TOM20 (D) in U2OS BAX/BAK DKO cells transected with FKBP‐ and FRB‐mCherry DRP1 (B, red), FKBP‐ and FRB‐EGFP‐BAX (C, green) or TOM20‐mCherry‐FKBP (red) and FRB‐EGFP‐BAX (green, D) before (0 min) and after induced dimerization (10 min). Mitochondria were stained using MitoTracker Deep Red FM or MitoSpy NIR (cyan) as indicated. Scale bar 20 µm. Pearson's correlation coefficient was calculated between the induced dimerization signal of BAX/BAX, DRP1/DRP1 and BAX/TOM20, respectively, and mitochondria based on MitoTracker Deep Red TM signal as depicted below the images.
-
EInduced dimerization of DRP1 and BAX mutants L63E, Δ19–37 or ΔL1–2. Confocal microscopy of U2OS BAX/BAK DKO cells transfected with FKBP‐mCherry‐DRP1 (red) and mutant variants FRB‐EGFP‐BAX (green) as indicated and stained with MitoTracker Deep Red FM (cyan). Images were acquired 10 min after induction of BAX/DRP1 dimerization. Scale bar 20 µm. All images are representative of n = 3 independent experiments.
-
F–HDimerization of BAX and DRP1 induces their translocation to mitochondria, exposure of the BAX 6A7 epitope and cytochrome c release. (F) Western blot analysis of cytosolic and mitochondrial fraction from U2OS BAX/BAK DKO overexpressing FKBP‐mCherry‐DRP1 and FRB‐EGFP‐BAX after induction of BAX/DRP1 dimerization (Dim) or apoptosis (Apo) compared to non‐treated (Ctrl) or untransfected cells (Untr). Western blot was probed against DRP1 and BAX. Mitofilin (IMMT) was used to test for purity of cytosolic fraction. Results are representative for n = 3 independent experiments. (G) Representative (n = 3 independent experiments) confocal microscopy images of U2OS BAX/BAK DKO cells transfected with FKBP‐mCherry‐DRP1 (red) and FRB‐EGFP‐BAX (green). Cells were immunostained against the 6A7 epitope of BAX (grey) after induced dimerization of BAX and DRP1 (Dimerizer) compared to untreated (Control). Images show individual channels or overlay of FKBP‐mCherry‐DRP1 and BAX‐(6A7) immunofluorescence signal. Scale bar 10 µm. (H) Representative (n = 3 independent experiments) western blot analysis of the cytosolic and mitochondrial fraction from U2OS BAX/BAK DKO treated as described in F) and probed against cytochrome c (Cytc). TOM20 was used to test for purity of cytosolic fraction. Protein staining (Ponceau S) is shown to confirm equal loading.
-
I–KQuantification of caspase activation, PARP cleavage and cell death induced by forced dimerization of BAX and DRP1. (I) U2OS BAX/BAK DKO cells were transfected with FKBP‐mCherry‐DRP1 and FRB‐EGFP‐BAX and analyzed for the percentage of cells with caspase 3/7 activation. Data are normalized to the number of transfected cells at individual time points after inducing dimerization of BAX and DRP1 (Dim, 30, 60 and 90 min) compared to apoptosis induction for 90 min (Apo, 90 min) or untreated cells (Ctrl). (J) Representative western blot analysis (n = 3 independent experiments) of total cell lysates from cells transfected as described in (I) after induction of BAX/DRP1 dimerization (Dim) or apoptosis (Apo) compared to non‐treated (Ctrl) or untransfected cells (Untr). Blot was probed against PARP or GAPDH as a loading control. K) U2OS BAX/BAK DKO cells were transfected as described in (I) and induced for BAX/DRP1 dimerization (Dim) or apoptosis (Apo) compared to untreated (Ctrl). Data are presented as fold increase of dead cells 1 h after treatment compared to the number of dead cells before treatment and normalized to the number of transfected cells.
Data information: Values in (I) and (K) are representative of n = 2 independent experiments and correspond to mean (bar, line) ± SD. Single data points in (I) represent individual measurements from technical and biological replicates.
Source data are available online for this figure.
