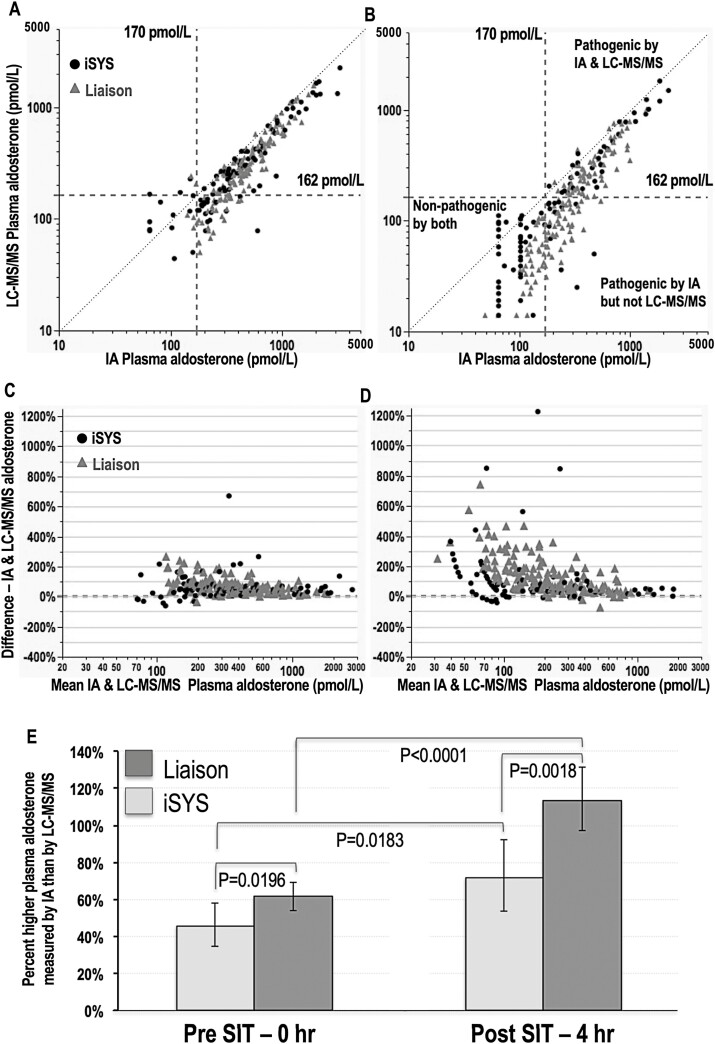
Figure 1.
Relationships between plasma concentrations of aldosterone measured by immunoassay versus LC-MS/MS at baseline (A) and at 4 hours after the SIT (B), modified Bland-Altman graphs to illustrate assay bias at baseline (C) and at 4 hours after the SIT (D) and bar graphs to illustrate differences between immunoassay and LC-MS/MS measured concentrations for the Liaison and iSYS immunoassays and at baseline (0 hours) and 4 hours after the SIT (E). Dashed vertical and horizontal lines in panels A and B show cutoffs for the SIT by both immunoassay (IA) and LC-MS/MS. The dotted lines illustrate lines of identity. For panels A-D results for the iSYS IA are shown as solid dots and for the Liaison IA as gray triangles. Results in panel E are shown as geometric means with CIs, and with statistical significance of percent differences determined by respective paired and unpaired t tests for comparisons of pre- and post-SIT percent differences and of Liaison versus iSYS immunoassays.

