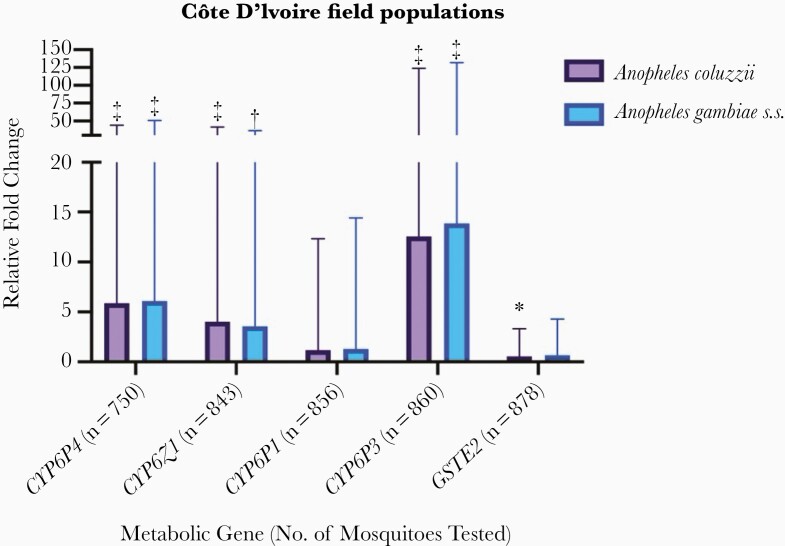
Figure 4.
Metabolic gene expression in field Anopheles coluzzii and Anopheles gambiae sensu stricto (s.s.) populations relative to a susceptible colony population. Error bars represent 95% confidence intervals. Statistically significant differences in expression levels relative to the susceptible colony are indicated as follows: *P < .05; **P < .01; ***P ≤ .001.

