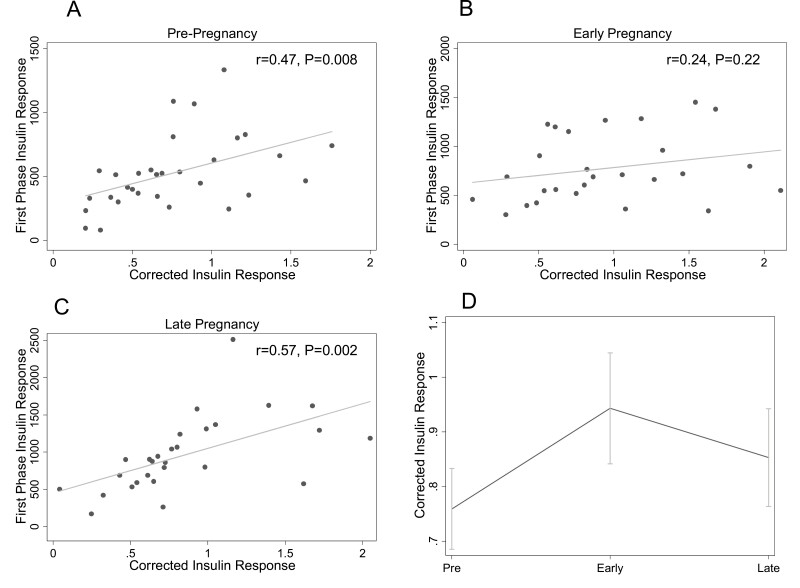
Figure 3.
Relationship between the corrected insulin response (CIR) and first-phase insulin response at each study timepoint. The relationships between CIR and first-phase insulin response (by intravenous glucose tolerance test) prepregnancy (A), in early pregnancy (B), and in late pregnancy (C) are shown. Panel D shows the change in CIR across pre-, early, and late pregnancy timepoints. The mean at each timepoint is plotted; the error bars depict the standard error of the mean.

