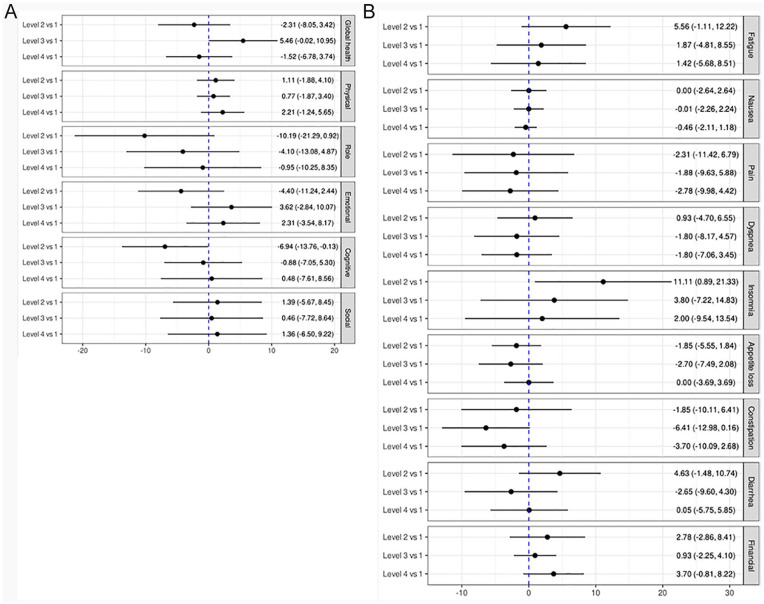
Figure 1.
Mean change in QLQ-C30 sub-scales compared to level 1. (A) QLQ-C30 global health and function scales (a positive change score reflects better health/functioning comparing the level to the referent level). (B) QLQ-C30 symptoms scales and items (a negative change score reflects lower symptom burden comparing the level to the referent level).

