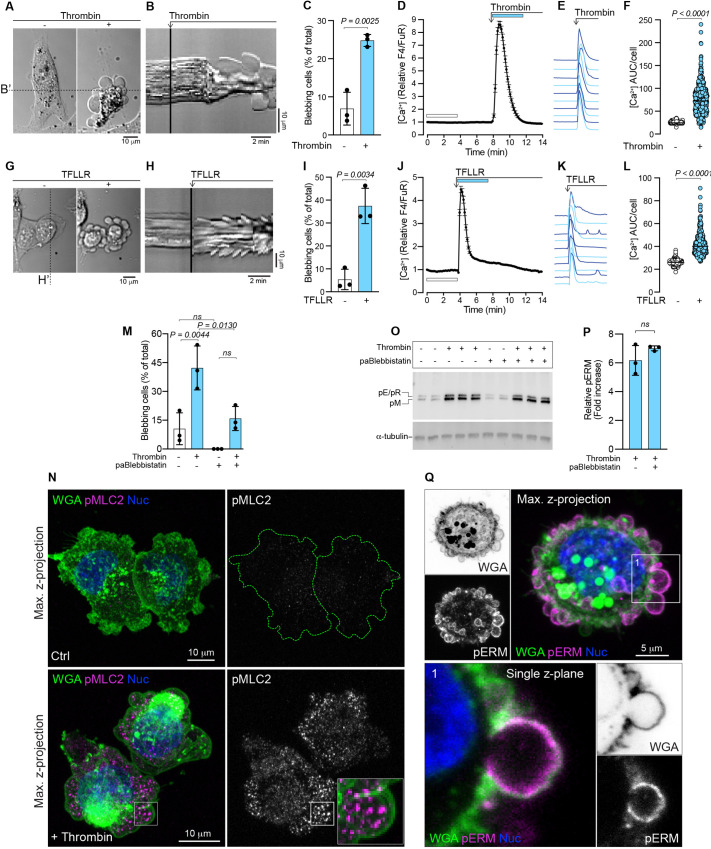
Fig. 1.
Thrombin stimulation and PAR1 activation induces blebbing in MDA-MB-231 cells. (A) Representative example of thrombin-induced blebbing in an MDA-MB-231 cell (see also Movie 2). The cell is presented before (left) and after (right) the addition of thrombin. Scale bar: 10 µm. (B) Kymograph plotted from the time-lapse signals recorded under the dashed line B′ in A; the point at which thrombin is added is indicated. Scale bars: 2 min (horizontal), 10 µm (vertical). (C) Quantification of blebbing in MDA-MB-231 cell populations before and after thrombin treatment. Bars represent the mean±s.d. from three experiments. (D) Thrombin-induced changes in cytosolic Ca2+ in MDA-MB-231 cells as quantified by ratiometric measurements of relative Fluo-4/Fura Red (F4/FuR) fluorescence. The mean values±s.e.m. over time for n=119 cells are plotted. (E) Examples of thrombin-induced Ca2+ responses from individual cells from the data set in D. (F) Quantification of Ca2+ area under the curve (AUC) per cell calculated from the relative F4/FuR plots for the durations indicated by the color-coded bars in D before and after thrombin treatment (n=593 cells, from the three experiments in C). (G) Induction of blebbing by TFLLR stimulation in an MDA-MB-231 cell. The cell is presented before (left) and after (right) the addition of TFLLR. Scale bar: 10 µm. (H) Kymograph plotted from the signal recorded under the dashed line H′ in panel G, the point at which TFLLR is added is indicated. Scale bars: 2 min (horizontal), 10 µm (vertical). (I) Quantification of blebbing in MDA-MB-231 cell populations before and after TFLLR treatment. Bars represent the mean±s.d. from three experiments. (J) Effect of TFLLR-treatment on cytosolic Ca2+. The plot represents the mean±s.e.m. over time for n=95 cells from one experiment. (K) Examples of TFLLR-induced Ca2+ responses from individual cells from the data set in J. (L) Quantification of Ca2+ AUC/cell for the durations indicated by the color-coded bars in J (n=392 cells from the three experiments in I). (M) Quantification of blebbing in MDA-MB-231 cell populations before and after thrombin treatment, and with or without pre-treatment (1 h) with para-aminoblebbistatin (paBlebbistatin). Bars represent the mean±s.d. for three experiments. (N) Maximum intensity z-projection images, collected by confocal microscopy, of control (Ctrl) and thrombin treated (+Thrombin) MDA-MB-231 cells immunostained for pMLC2 and counterstained with WGA for the plasma membrane, and NucBlue (Nuc) for nuclei. The peripheries of the pMLC2-stained Ctrl cells are outlined with a dashed green line. The inset in the lower right panel encloses a single bleb and illustrates pMLC2 distribution relative to the bleb membrane. Scale bars: 10 µm. (O) Immunoblotting for pERMs (pE, phospho-ezrin; pR, pospho-radixin; pM, phospho-moesin) in MDA-MB-231 cells pre-treated (1 h) with or without para-aminoblebbistatin (20 µM), followed by thrombin (1 U/ml) exposure for 5 min. α-tubulin was used as a loading control. The sample lanes for each condition represent biological replicates from the same experiment. (P) Quantification of pERM levels relative to α-tubulin, induced by thrombin with and without para-aminoblebbistatin pre-treatment from the blots in O; bars represent the mean±s.d. (Q) Maximum intensity z-projection image, collected by confocal microscopy, of a thrombin-treated MDA-MB-231 cell immunostained for pERMs and counterstained with WGA and NucBlue. A single z-plane from region 1, which is framed and enlarged, illustrates enrichment of pERMs associated with the bleb membrane. Scale bar: 5 µm. The P-values were determined by using an unpaired two-tailed Student's t-test in C, I and P, one-way ANOVA with Tukey's multiple comparisons in M, and Wilcoxon matched-pairs signed rank test in F and L. ns, not significant.

