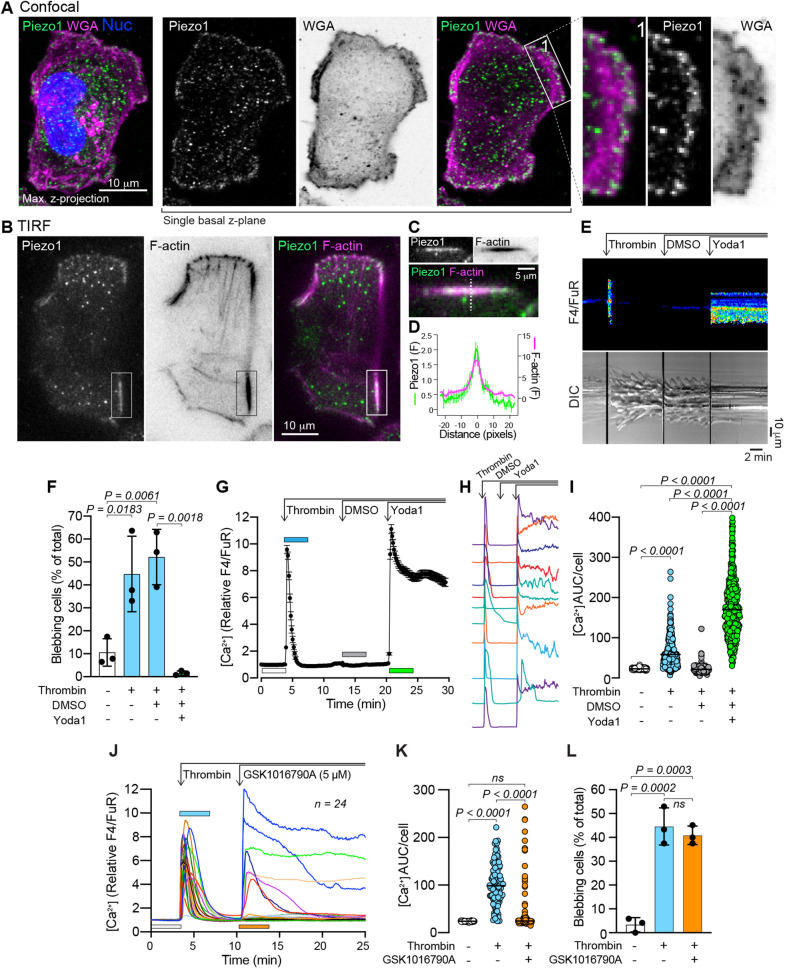
Fig. 4.
Piezo1 activation by Yoda1 attenuates thrombin-induced blebbing. (A) Maximum intensity z-projection image, collected by confocal microscopy, of an MDA-MB-231 cell immunostained for Piezo1 and counterstained with WGA and NucBlue. A single z-plane from the same z-stack reveals Piezo1 distribution in the most basal region of the plasma membrane, and the framed and enlarged region 1 illustrate the presence of Piezo1 enrichment at the periphery of the cell. Scale bar: 10 µm. (B) TIRF microscopy images of a cell stained for Piezo1 and F-actin. Scale bar: 10 µm. (C) Enlarged and rotated view of the area enclosed by the rectangle in panel B. Scale bar: 5 µm. (D) Relative fluorescence intensity profile of Piezo1 and F-actin staining under linear regions of interest similar to that indicated by the dashed line in C, i.e. plotted transversely through F-actin filaments. The plot represents the mean±s.e.m. from 11 structures from three cells. (E) Kymographs of the changes in cytosolic Ca2+ (top) and cell morphology (bottom) before and after sequential addition of thrombin, DMSO and Yoda1 in a single MDA-MB-231 cell, recorded by confocal and DIC microscopy (see also Movie 4). Scale bars: 2 min (horizontal), 10 µm (vertical). (F) Quantification of blebbing in MDA-MB-231 cell populations before and after sequential addition of thrombin, DMSO, and Yoda1. Bars represent the mean±s.d. from three experiments. (G) Changes to cytosolic Ca2+ (relative F4/FuR ratio) in cells before and after thrombin (1 U/ml), DMSO and Yoda1 (20 µM) addition. The plot represents the mean±s.e.m. over time (n=148 cells). (H) Examples of individual Ca2+ responses during sequential thrombin, DMSO and Yoda1 treatment from individual cells. (I) Quantification of Ca2+ AUC/cell from the relative F4/FuR plots for the durations indicated by the color-coded bars in G (n=401 cells from the same three experiments analyzed in F). (J) Changes to cytosolic Ca2+ (relative F4/FuR ratio) in cells before and after thrombin (1 U/ml) and the TRPV4 agonist GSK1016790A (5 µM) addition. Plots from individual cells (n=24) from one experiment are presented. (K) Quantification of Ca2+ AUC/cell from the relative F4/FuR plots for the durations indicated by the color-coded bars in J (n=106 cells from three experiments). (L) Quantification of blebbing in MDA-MB-231 cell populations before and after sequential addition of thrombin and GSK1016790A. Bars represent the mean±s.d. from the same three experiments analyzed in K. The P-values were determined by using one-way ANOVA with Tukey's multiple comparisons in F and L, and the Friedman test with Dunn's multiple comparisons in I and K.

