Fig. 6.
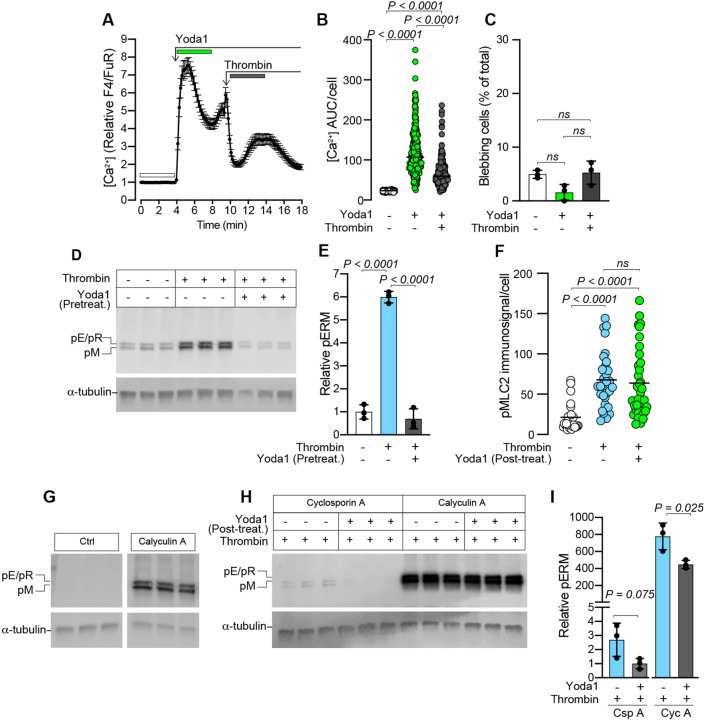
Pretreatment with Yoda1 inhibits thrombin-induced blebbing and ERM phosphorylation. (A) Yoda1- (20 µM) and thrombin- (1 U/ml) induced changes to cytosolic Ca2+ in MDA-MB-231 cells. The plot represents the mean±s.e.m. over time for n=70 cells from one experiment. (B) Quantification of Ca2+ AUC/cell for the durations indicated by the color-coded bars in A (n=258 cells from three experiments). P-values were determined by the Friedman test with Dunn's multiple comparisons. (C) Quantification of blebbing in cell populations treated sequentially with Yoda1 and then thrombin as indicated; bars represent the mean±s.d. for the same three experiments analyzed in B. P-values were determined by one-way ANOVA with Tukey's multiple comparisons. (D) Immunoblotting for pERMs in cells pre-treated for 15 min with or without Yoda1 (20 µM), followed by thrombin (1 U/ml) exposure for 5 min. (E) Quantification of pERM band intensities relative to α-tubulin loading controls for the samples in panel D. Bars represent the mean±s.d. for three samples. (F) Quantitative image analysis of pMLC2 immunofluorescence/cell in untreated control cells, or cells treated with thrombin (5 min), followed by 10 min incubation with or without Yoda1. Plots represent average pMLC2 intensity for n=26, 30 and 35 cells, respectively from one experiment. P-values were determined by Kruskal–Wallis test with Dunn's multiple comparisons. (G) Immunoblotting for phosphorylated ERMs in cells incubated with or without Calyculin A (50 nM); the Ctrl and Calyculin A panels in G were cropped from the same immunoblotted membrane. (H) Immunoblotting for pERMs in cells first stimulated with thrombin (1 U/ml) followed by 5 min treatment with Calyculin A (50 nM) or Cyclosporin A (250 nM), and subsequently (5 min later) treated with or without Yoda1 (20 µM) for 15 min. α-tubulin was used as a loading control in D, G and H. (I) Quantification of pERM band intensities relative to α-tubulin loading controls for the samples in F. Bars represent the mean±s.d. The P-values were determined by unpaired two-tailed Student's t-test. For the immunoblots in D, G and H, the sample lanes for each condition represent biological replicates from the same experiment.

