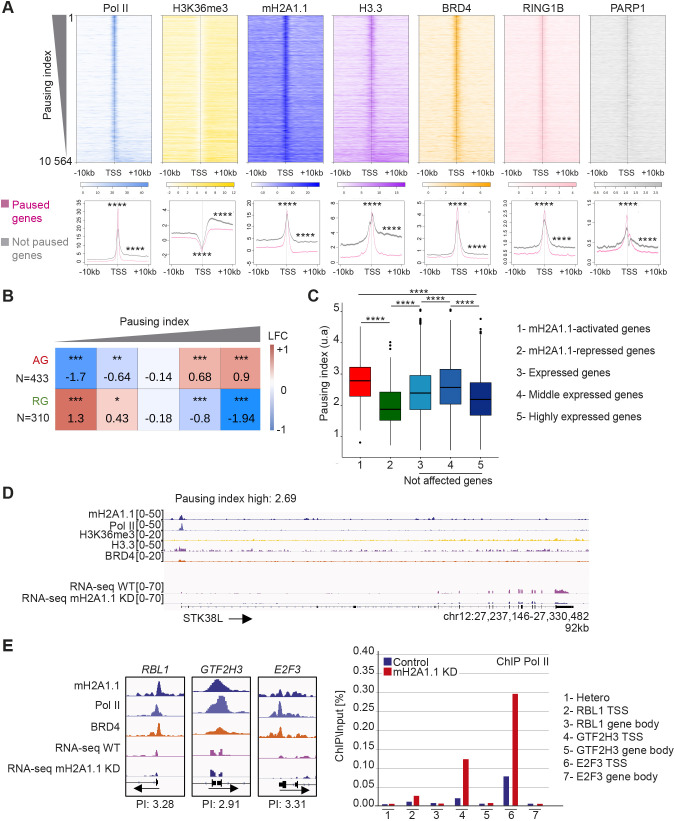
Fig. 4.
mH2A1.1-activated genes are regulated by Pol II pausing. (A) Top: Heatmap profiles showing enrichment of indicated factors and modifications around the TSS (±10 kb) of transcribed genes (n=10,198) ranked by their PI. Color intensity reflects the level of ChIP-seq enrichment. Heatmaps are oriented. Bottom: Metagene profiles of average (±s.e.m.) of the indicated ChIP-seq data around the TSS (±10 kb) of paused and not paused genes, as indicated in pink and gray, respectively. Genes are considered as paused if their PI is >2 (n=7208). Genes are considered as ‘not paused’ if PI<2 (n=3356). Results of statistical difference analysis between these two groups are shown, either on the TSS (±50 bp) or on the gene body (+50 bp – TES). Wilcoxon tests were used to compare conditions. ****P<2.2×10⁻¹⁶. (B) Fisher test heatmap showing enrichment of indicated mH2A1.1-target genes with genes divided into five equal-sized categories as a function of their PI. Asterisks indicate the significance of the Fisher exact tests; color map and values present in each square highlight the log2 odds ratio (LOR) of the Fisher exact test. N indicates the number of genes used for the analysis. (C) Boxplot comparing the PI of the indicated groups of genes. (Gene number in each group: 1, n=433; 2, n= 310; 3, n= 9 645; 4, n=5 176; 5, n=4.469). The box represents the 25–75th percentiles, and the median is indicated. Whiskers extend to 25th percentile minus 1.5× IQR and 75th percentile plus 1.5× IQR. Wilcoxon tests were used to compare conditions. ****P<2.2×10⁻¹⁶. Only genes characterized by a PI were used. (D) Genome browser view of the indicated ChIP-seq on a paused gene. Unstranded RNA-seq signals in control and mH2A1.1 KD conditions are shown. Black arrows indicate direction of transcription. Only genes characterized by a PI were used. (E) Left: Genome browser view of ChIP-seq of three mH2A1.1-activated genes (RBL1, GTF2H3, E2F3). These genes are considered as paused genes with PIs of 3.28, 2.9 and 3.2, respectively. Right: ChIP-qPCR of Pol II on WT and mH2A1.1-depleted cells. ‘Hetero’ corresponds to a negative position. For each gene, Pol II enrichment was evaluated on the TSS and a gene body region. Results from additional biological replicates are given in Fig. S4D.

