Fig. 6.
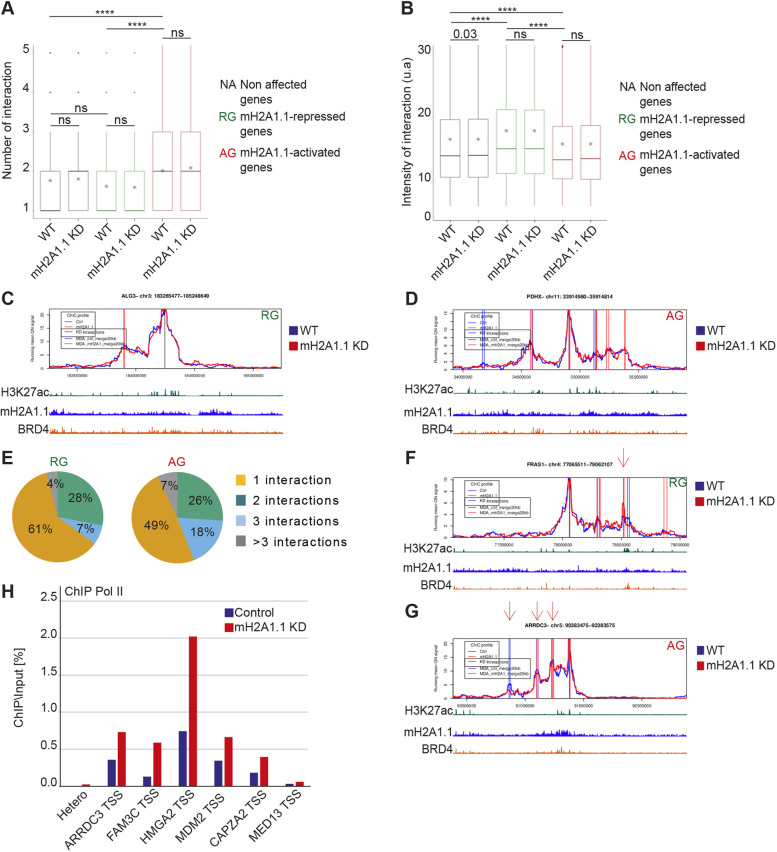
mH2A1.1 regulates gene expression within predefined 3D chromatin domains. (A) Boxplot showing the average number of PCHiC significant interactions per gene with adjacent genomic regions between genes not affected by mH2A1.1, mH2A1.1-repressed genes (n=181) and mH2A1.1-activated genes (n=282) in control and mH2A1.1 KD conditions. PCHiC significant interactions were determined using ChiCMaxima (Ben Zouari et al., 2019). The box represents the 25–75th percentiles, and the median is indicated (middle line). Whiskers extend to 25th percentile minus 1.5× IQR and 75th percentile plus 1.5× IQR. * represents the mean. Paired Wilcoxon tests were used to compare control and mH2A1.1 KD conditions whereas unpaired Wilcoxon tests were used to compare gene categories. ns, not significant. ****P<2.2×10⁻¹⁶. (B) Boxplot showing the mean of intensity of PCHiC interactions per gene between genes not affected by mH2A1.1, mH2A1.1-repressed genes (n=181) and mH2A1.1-activated genes (n=282) in control and mH2A1.1 KD conditions. Features of the boxplot and statistical tests as for A. (C,D) Snapshot of PCHiC dataset on the mH2A1.1-repressed ALG3 gene (C) and the mH2A1.1-activated PDHX gene (D) in control and mH2A1.1 KD conditions. Interaction intensity between the target gene and the associated genomic region are plotted over a 2 Mb gene domain around the promoter bait. Control (blue line) and mH2A1.1 KD (red line) are shown. The vertical bars correspond to PCHiC significant interactions conserved between the two biological replicates in each condition. (E) Pie charts showing the percentage of mH2A1.1-target genes having one, two, three or more than three PCHiC significant interactions. (F) As in C, but this mH2A1.1-repressed gene, FRAS1, shows a reproducible gain of interaction with a specific genomic region (red arrow). (G) As in D, but this mH2A1.1-activated gene, ARRDC3, shows a reproducible reduction of interaction with specific genomic regions (red arrows). (H) ChIP-qPCR of Pol II on WT and mH2A1.1-depleted cells on six genes that show significative loss of interactions with adjacent genomic regions. Snapshots of PCHiC data set are shown in Fig. S6C. ‘Hetero’ corresponds to a negative position. For each gene, Pol II enrichment was evaluated only on the TSS. Results from additional biological replicates are given in Fig. S4E. For the snapshots of PCHiC data, only results from replicate number 1 are shown here; see Fig. S6A,B for replicate number 2.

