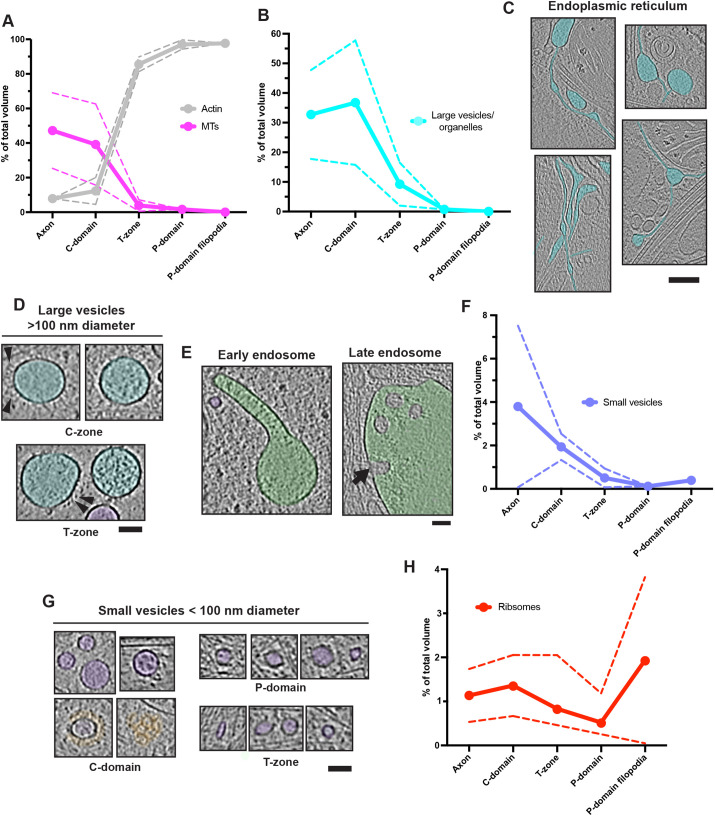
Fig. 1.
Analysis of growth cone component distribution. (A) Growth cone distribution of microtubules (MTs) and F-actin segmentation volumes. (B) Large vesicle and organelle (including mitochondria) segmentation volumes. (C) C-domain smooth ER, cyan false colour. (D) Large vesicles, false coloured in cyan. Arrowheads, embedded proteins. (E) C-domain endolysosomal components (left: early/sorting endosome; right: late endosome/multi-vesicular body), false coloured in green. Arrow indicates inward budding site. (F) Large vesicle and organelle segmentation volumes. (G) Small vesicles <100 nm diameter, false coloured in purple; clathrin coats, false coloured in orange. (H) Segmentation volume of ribosomes. Panels C–E and G show longitudinal views in tomograms (4× binned). Absolute segmentation volumes were measured in Chimera (Pettersen et al., 2004), and relative segmentation volume for each feature is expressed as a percentage of the total volume of all these features combined. Axon, n=2; C-domain, n=3; T-zone, n=3; P-domain, n=2; P-domain filopodia, n=2. Solid lines represent mean volumes, dashed lines indicate s.d. Scale bars: C, 100 nm; D,E,G, 60 nm.

