Fig. 3.
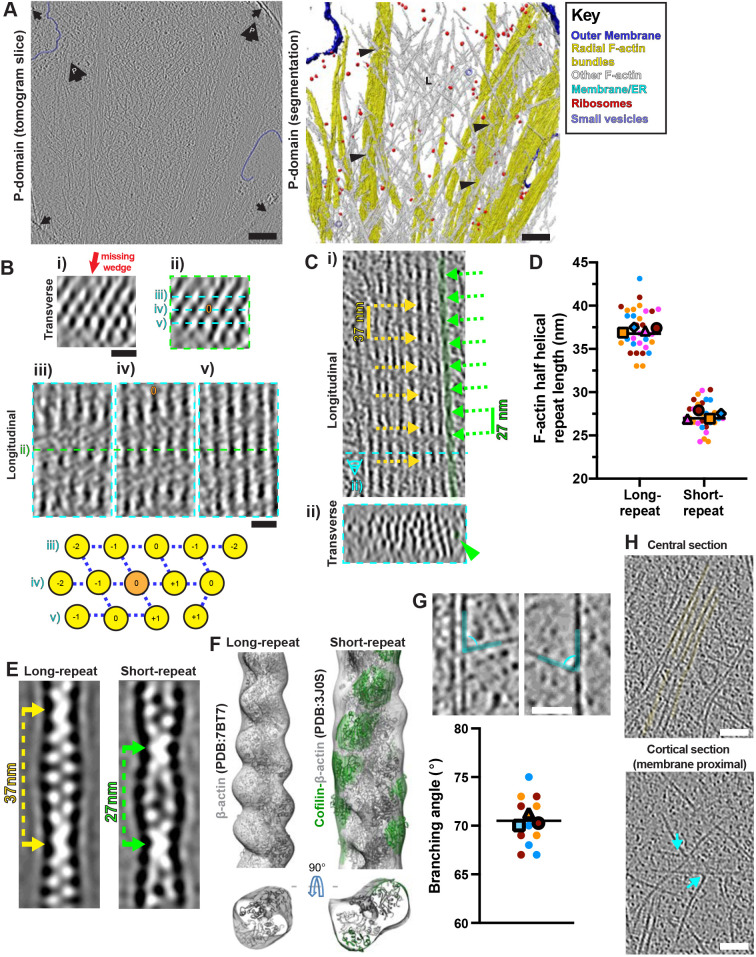
Complexity and modulation of F-actin arrays in growth cone P-domains. (A) Central tomogram section (4× binned, left), segmented rendering (right) of a P-domain region. Left: large black arrows containing a ‘P’, position of cell front; black arrows, carbon hole edges. Right: L, lamellipodial; black arrowheads, branched F-actin networks surrounding F-actin bundles. Key indicates false colouring. (B) (i) Transverse view (2× binned) through filopodial bundle (∼20 nm depth), showing the hexagonal arrangement; red arrow, missing-wedge direction. (ii) Same bundle and view; cyan dashed lines, longitudinal sections of panels. (iii–v) The centre of the transverse section in i and ii is indicated with a green dashed line in panels iii–v. A central filament is indicated, orange ‘0’ in panels ii and iv. Bottom: transverse schematic of filament arrangement, with the central ‘0’ filament in orange. Numbers indicate how longitudinal F-actin repeats shift by integers of 5.5 nm along the filament axis relative to the central filament. (C) (i) Longitudinal and (ii) transverse (∼20 nm depth) views of a large F-actin bundle in a 2x binned P-domain tomogram. Dashed cyan line in i illustrates position of transverse section in ii. ∼37 nm F-actin half helical repeat lengths indicated with yellow dashed arrows, rarer ∼27 nm F-actin half helical repeat lengths indicated with green dashed arrows. A short-repeat filament is false coloured in green and indicated in ii with a green arrowhead. (D) Super-plot of P-domain F-actin half helical repeat lengths. Individual points indicate single measurements along a filament axis, colours indicate different filaments. Mean values for each filament are shown in their respective colours with different larger shapes. Individual lines indicate overall median values. Repeat lengths for long-repeat filaments, 37.2±2.4 nm n=32, 4 filaments (3 tomograms); repeat lengths for short-repeat filaments; 27.3±1.6 nm, n=30, 4 filaments (3 tomograms). Values represent the mean±s.d. (E) Projections through subtomogram averages of long-repeat (left) and short-repeat (right) filaments showing half repeat distances. The sub-tomogram densities were calculated by averaging 1461 and 621 volumes for long-repeat and short-repeat filaments, respectively. Volumes were low-pass filtered to their estimated resolutions at Fourier shell correlation (FSC)=0.5 (Fig. S6). (F) Subtomogram averages of long-repeat filaments (left, mesh density) and short-repeat (right, mesh density) filaments with fitted F-actin (PDB: 7BT7) or F-actin–cofilin (PDB: 3J0S) models, respectively, noting that polarity of filament fitting is arbitrary and cannot be determined from the reconstructions. F-Actin and cofilin models are coloured in grey and green, respectively, with mesh density coloured to match the underlying models (within 10 Å). (G) P-domain tomogram sections (4× binned) illustrating F-actin branching from bundles (top left) and single filaments (top right), indicated with cyan false colouring. Bottom: Super-plot of P-domain branching angles. Each data point represents an individual branching structure (n=12 from 3 tomograms, shown as different colours). Mean values for each tomogram are shown in their respective colours with different larger shapes. Line indicates the overall mean (70.1±2.6°, mean±s.d.). (H) Longitudinal sections of a 2× binned P-domain tomogram through a central region showing radial F-actin bundles in false yellow colour (top) and the corresponding overlying cortical region (bottom), showing F-actin branching points at the cell cortex, indicated with cyan arrows. Scale bars: A, 200 nm; B, 20 nm; G, 40 nm; H, 50 nm.

