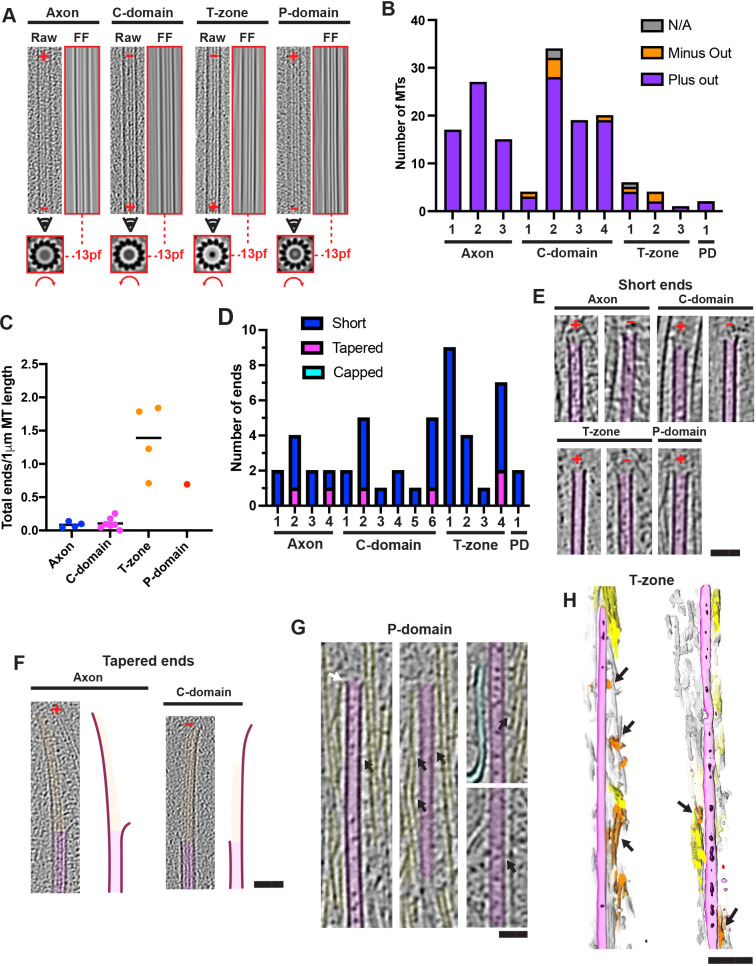
Fig. 5.
Organisation and architectures of microtubules within growth cones. (A) Representative examples of MTs illustrating protofilament number and polarity. Each set of 3 images includes a ∼30 nm thick longitudinal section through MT volume (2× binned, left) with corresponding image Fourier filtered at the origin (right, red box) showing 13-protofilament moiré patterns. Below, corresponding MT rotational average of 30 nm thick section viewed towards the cell periphery, showing protofilament number and handedness (curved red arrow). When viewed from the minus end or plus end, rotational average images exhibit clockwise or anticlockwise slew, respectively. In longitudinal sections, growth cone periphery is towards top; plus and minus end directions are indicated (red ‘+’ and ‘–’); consensus protofilament (pf) architecture is indicated between dashed red lines. (B) MT polarity relative to neuron periphery in individual tomograms. MTs assigned ‘N/A’ were perpendicular to the axon axis or bent ∼180°. Axon, 59 total plus-end peripheral MTs, 0 minus-end peripheral from 3 tomograms (each a different cell); C-domain, 69 total plus-end peripheral MTs, 6 minus-end peripheral, 2 N/A from 4 tomograms (each a different cell); T-zone, 7 total plus-end peripheral MTs, 3 minus-end peripheral, 1 N/A from 3 tomograms (each a different cell); P-domain (PD), 2 total plus-end peripheral MTs, 0 minus-end peripheral, 0 N/A from 1 tomogram. (C) MT ends frequency per 1 µm MT length in individual tomograms. Each data point represents a separate tomogram; axon (n=4), C-domain (n=7), T-zone (n=4), P-domain (n=1). Line indicates mean from all tomograms for each region. 50 MT ends were found in a total of 318 μm MT length. (D) Number of short and tapered ends in individual tomograms (number of tomograms of axon, n=4; C-domain, n=7, 1 tomogram contained no ends; T-zone n=4; P-domain, n=1). (E) Longitudinal views of short MT ends. (F) Longitudinal views of tapered MT ends. Short ends – 10 nm thick slices through 4× binned tomograms; tapered ends – 30 nm thick slices through 2× binned tomograms, false coloured in magenta and orange, respectively. Right: traced representations. Plus and minus ends are indicated (red ‘+’ and ‘–’). (G) Four longitudinal sections through regions of a single MT associated in parallel with P-domain F-actin bundles. Black and white arrows indicate crosslinks between MT shaft or tip and F-actin bundles, respectively; cyan indicates ER. (H) Two 3D sections (left and right) through T-zone segmentations; black arrows indicate transverse F-actin bundles running perpendicular on dorsal and ventral surfaces of periphery-orientated MTs. Segmentation colouring is as in Fig. 4A. Scale bars: E–G, 50 nm; H, 100 nm.

