Fig. 8.
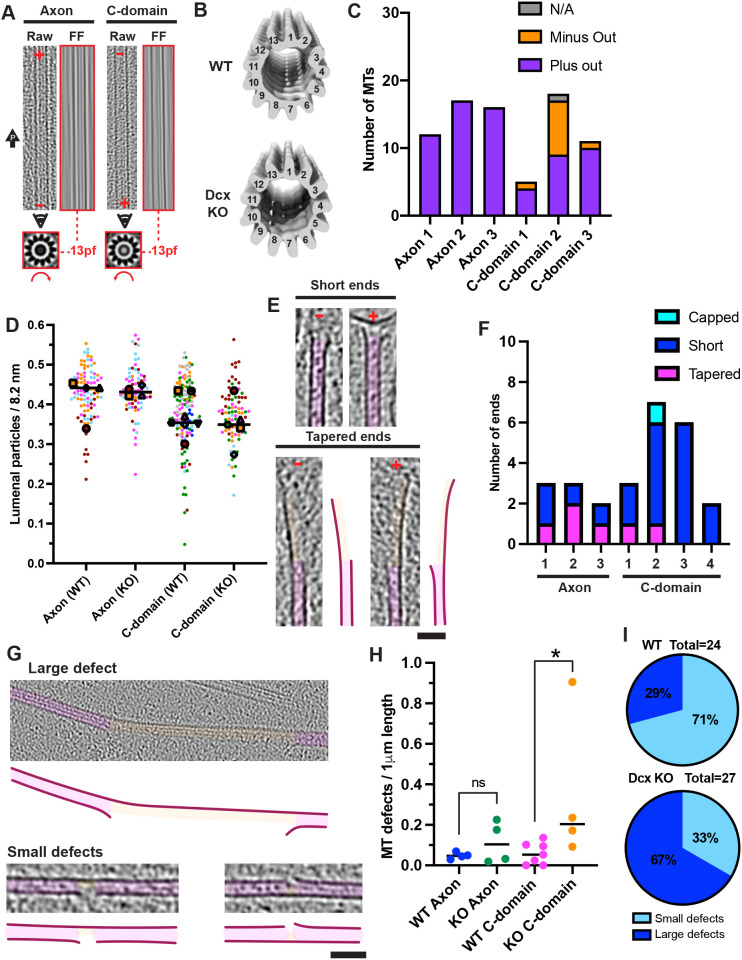
Increased MT defects in doublecortin knockout neuronal growth cones. (A) Representative images of Dcx KO neuron MTs showing protofilament number and polarity, as described in Fig. 7A. The arrow labelled ‘P’ indicates position of the cell front. (B) Transverse views (viewed from plus end) of sub-tomogram averages of random 13-protofilament MT subsets in WT (top, 1200 MT segments, 13 MTs) and Dcx KO (bottom, 1190 MT segments, 20 MTs) neurons. Volumes were low-pass filtered to estimated resolutions (Fig. S7C). (C) MT polarity relative to neuron periphery in individual tomograms. MTs assigned ‘N/A’ were either perpendicular to the axon axis or bent ∼180° such that both minus and plus directions were orientated peripherally. Axon, 45 plus-end peripheral MTs, 0 minus-end from 3 tomograms (3 axons); C-domain, 23 plus-end peripheral MTs, 10 minus-end, 1 N/A from 3 tomograms (3 neurons). (D) Super-plot of lumenal particle frequency per 8.2 nm. Each small data point represents a separate MT coloured by tomogram, mean frequency for individual tomograms indicated with large coloured shapes, lines indicate the overall medians. Overall means: WT axon, 0.43±0.07 nm, n=94 MTs, 4 tomograms; C-domain, 0.38±0.09 nm, n=134 MTs, 7 tomograms. Dcx KO axon, 0.43±0.06 nm, n=78 MTs, 4 tomograms; Dcx KO C-domain, 0.37±0.07 nm, n=84 MTs, 5 tomograms. Values represent the mean±s.d. (E) Longitudinal views (4× binned) of short and tapered MT plus and minus ends in Dcx KO growth cones. (F) Absolute numbers of short, tapered and capped MT ends in Dcx KO grow cones. Dataset size, total individual MT number in multiple tomograms (5 Dcx KO axon tomograms, 2 had no ends; 4 Dcx KO C-domain tomograms). (G) Longitudinal views (4× binned) of example MT defects in Dcx KO growth cones. (H) Frequency of defects per 1 µm MT length in WT and Dcx KO neurons. Each data point represents a separate tomogram; WT axon, 4; WT C-domain, 7; Dcx KO axon, 3; Dcx KO C-domain, 4. Mann–Whitney tests; WT C-domain versus Dcx KO C-domain, *P<0.05; WT C-domain versus Dcx KO C-domain with outlier data point removed, P=0.1083 (not significant); WT axon versus Dcx KO axon, P=0.89 (ns, not significant). (I) Numbers of large and small MT lattice defects as a percentage of total MT lattice defects in WT (top) and Dcx KO (bottom) pre-cone axons and C-domains. Dataset sizes indicate the total number of defects. Panels E and G: MTs and lattice defects are false coloured in magenta and orange, respectively; traced representation (right and bottom) shown for clarity. Scale bars: E,G, 50 nm.

