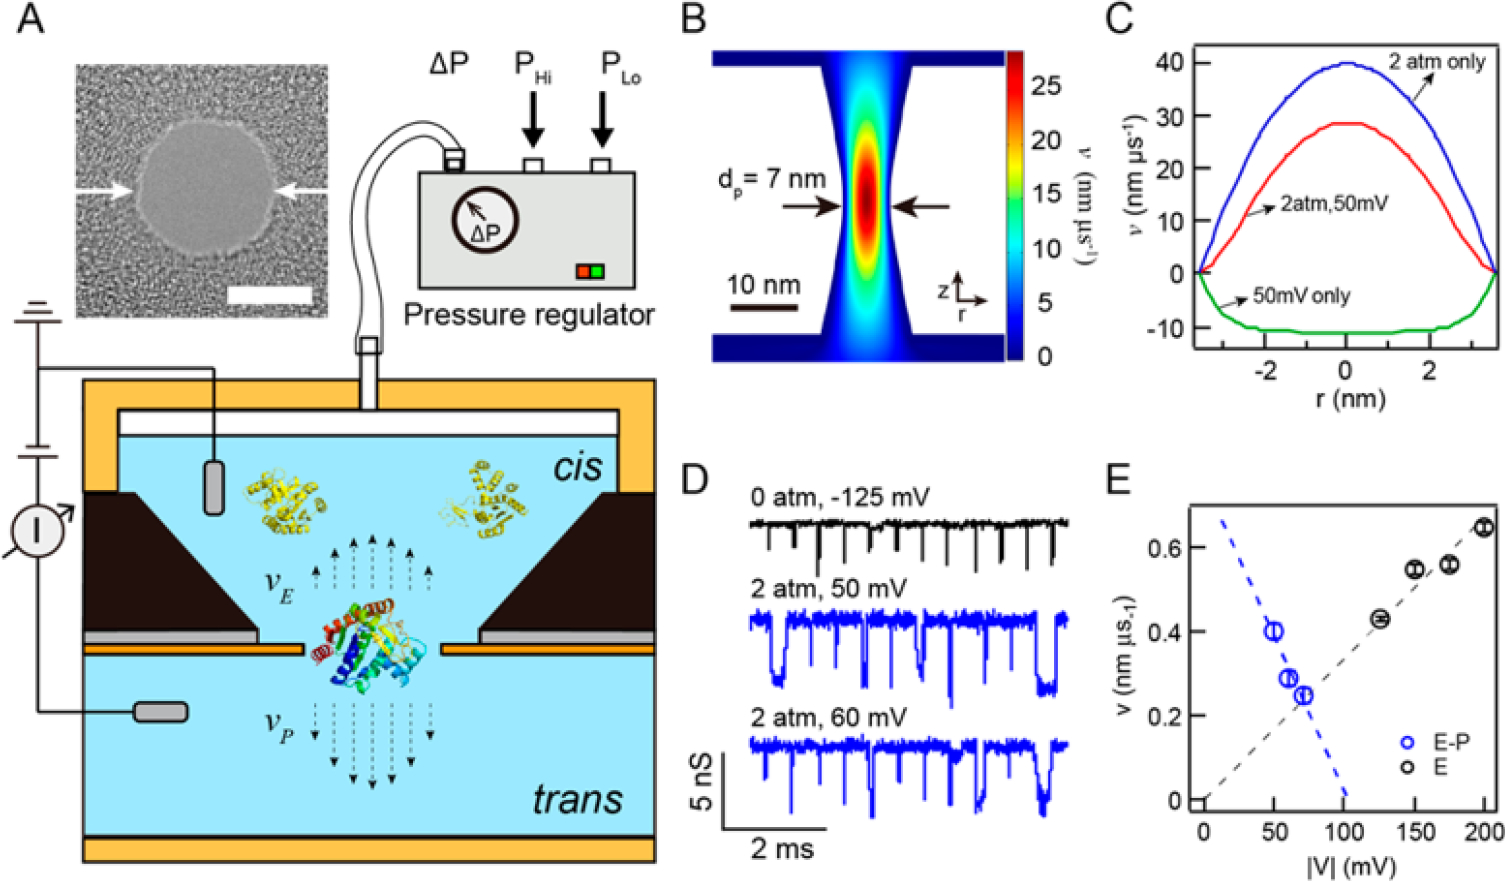
Figure 1.

Pressure-driven protein transport. (A) Schematic (not-to-scale) that depicts our setup, in which feedback control between pressure-regulated air (Phi) and atmospheric air (PLo) produces an overhead air pressure atop a sealed cis chamber of a nanopore cell. Prior to sealing, a solution that contains a protein sample is introduced to the cis chamber, and an electrode is placed in contact with the solution. Set pressure (ΔP) produces volume flow across the pore toward the trans chamber, and an opposing electric field electrokinetically retards protein flow. The dashed arrows represent pressure-driven (vP) and electrokinetically driven (vE) velocities whose shape was determined from finite-element simulations. A TEM image of a 7 nm diameter silicon nitride (SiN) nanopore is shown above the schematic (scale bar = 5 nm). (B) Color contour plot of a three-dimensional finite-element COMSOL simulation of the net velocity profile around an hourglass-shaped nanopore (dp = 7 nm, heff= 7 nm) with ΔP = 2 atm and V = +50 mV, the latter producing electro-osmotic flow from trans to cis, (C) Velocity plots along the pore profile at z = 0, the narrowest pore constriction, obtained for various conditions from the COMSOL simulation (0.4 M KCl, pH 8). Positive velocities imply flow from the cis chamber to the trans chamber. (D) Concatenated sets of analyzed AdK translocation events obtained under various indicated conditions (data digitally low-pass-filtered to 100 kHz in this presentation). (E) Extracted drift velocities (v) as a function of absolute values of applied voltage |V| for AdK transport using pressure-driven (V > 0, P > 0) and electrically driven (V < 0, P = 0) modes. Dashed lines are linear fits to the data, extrapolated to the range of the plots.
