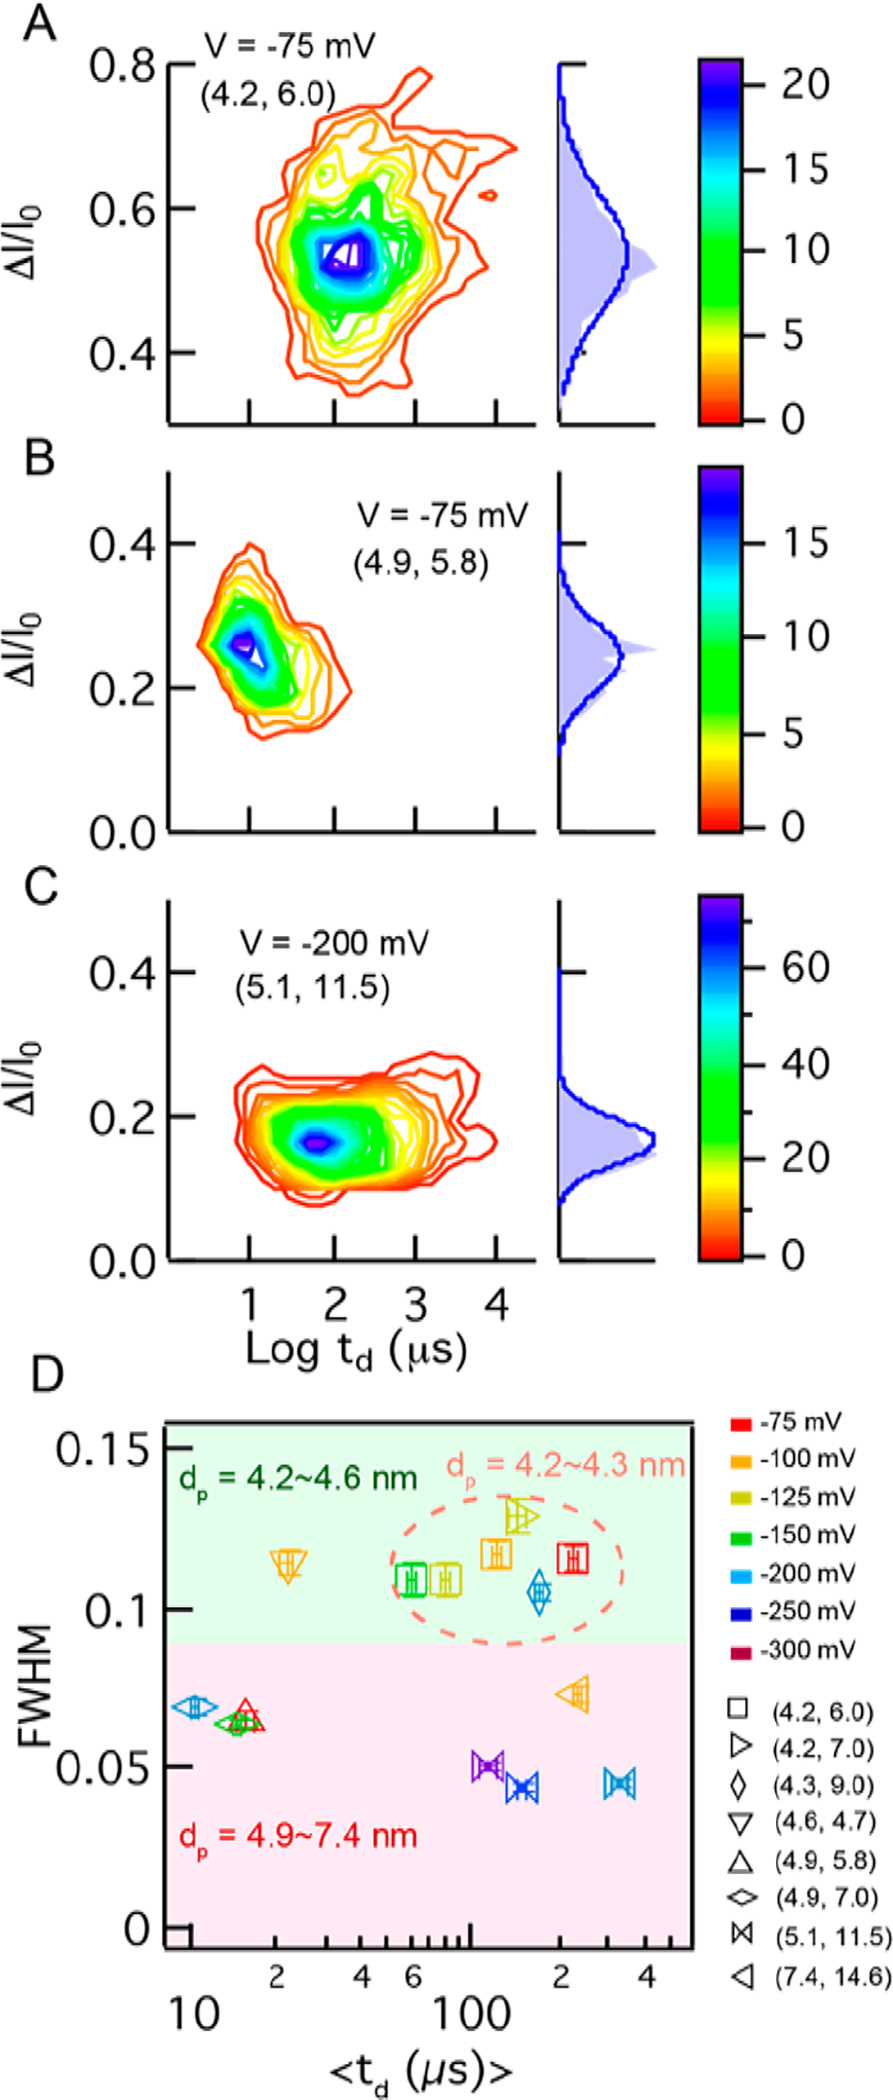
Figure 4.

Influence of pore geometry on DHFR signal characteristics. (A–C) Color contour plots of ΔI/I0 vs log(td) for DHFR mutant C7, as well as normalized ΔI/I0 distributions shown to the right of each plot, obtained from nanopores with different geometries indexed as (dp, heff) in each plot. The y-axis scales are set to the same height (though not the same values). (D) Summary plot of fwhm and mean td values obtained from eight different nanopores at various voltages (coded by colors in the legend). Data are bisected to two regions on the plot based on pore diameter, which shows that 4.2–4.6 nm pores (green-shaded area) provide consistent fwhm values, and in the range 4.2–4.3 nm, consistent dwell times are obtained as well (dashed orange circle).
