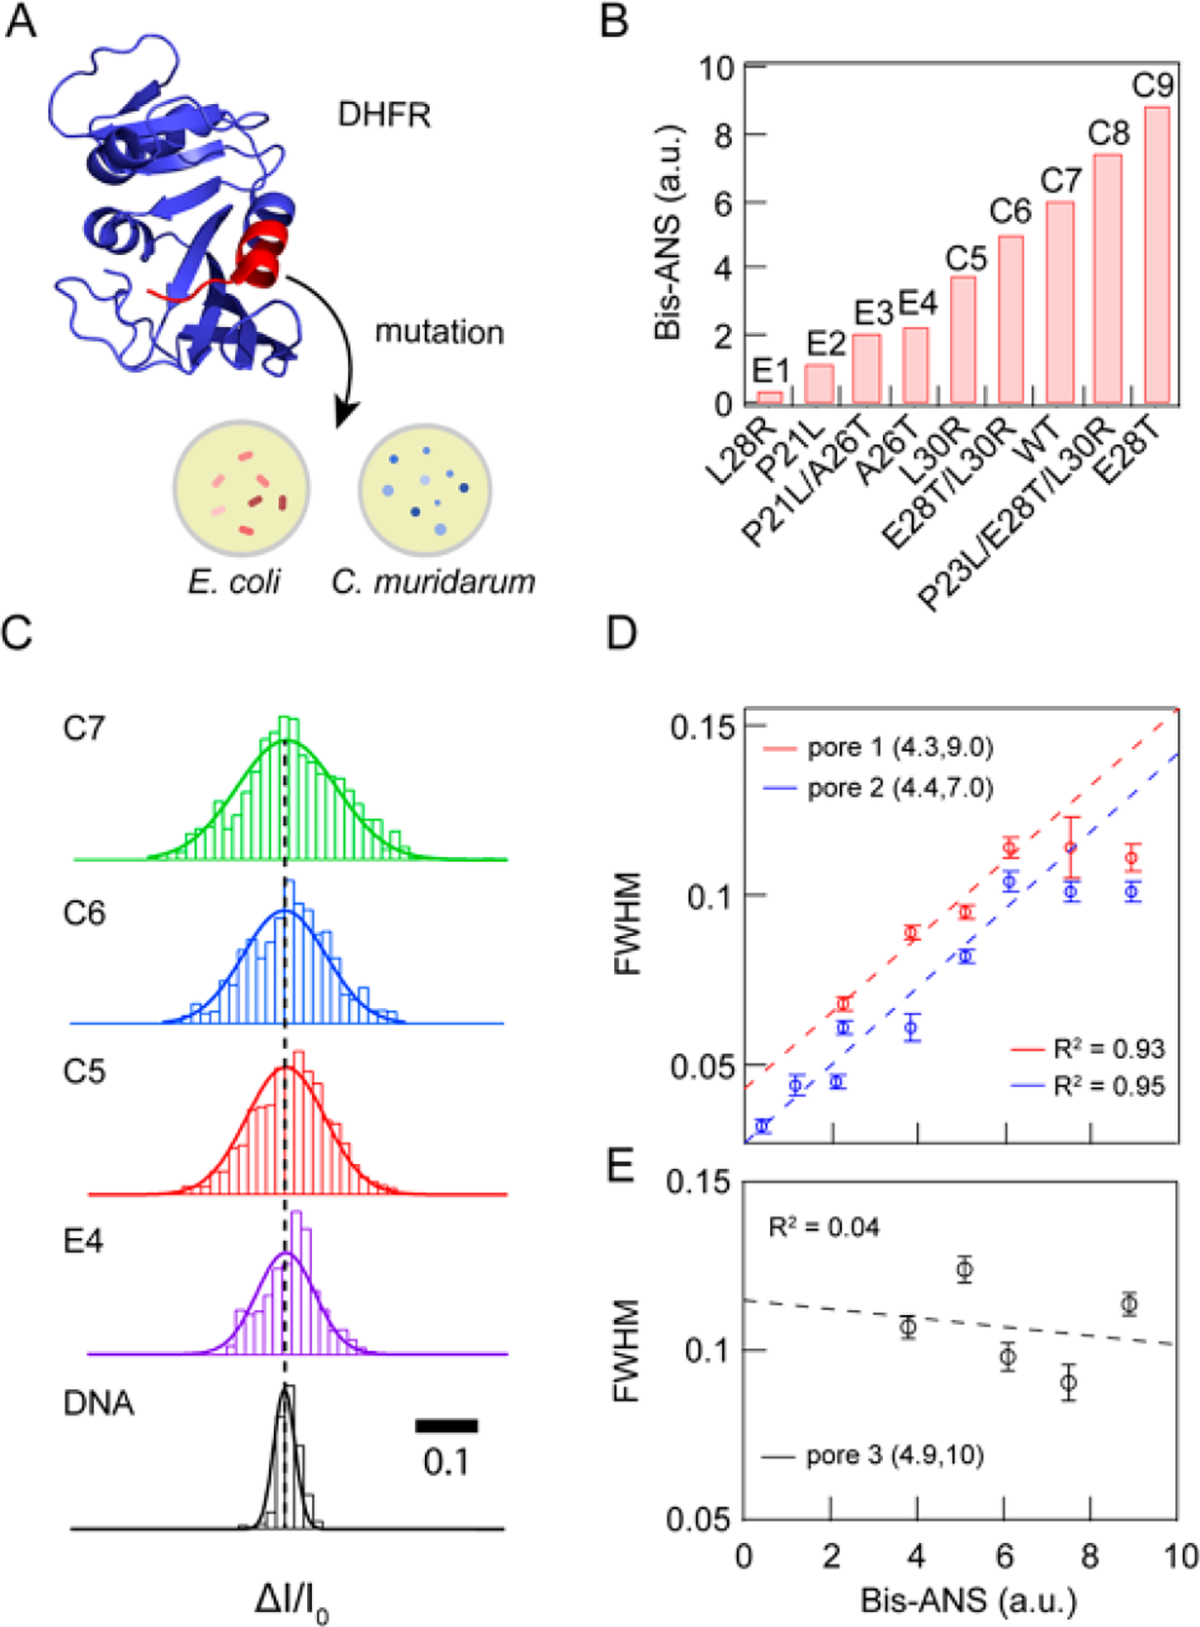
Figure 5.

Correlation of DHFR mutant conformational flexibilities with bulk fluorescence data. (A) PDB-based cartoon of DHFR (PDB ID 5DFR). The region for which we probed various mutants is shown in red. (B) Bis-ANS fluorescence intensities (relative to wt R coli DHFR) for a set of nine DHFR mutants originating from R coli and C muridarum, arranged in ascending order of bis-ANS fluorescence, a reporter of protein flexibility. (C) Comparative display of AZ/I0 distributions and corresponding Gaussian fits for mutants C7, C6, CS, and E4 (acquired at −100 mV from pore 1, data filtered to 250 kHz), as well as 1 kbp double-stranded DNA for comparison (acquired at 300 mV from a nanopore with the same dimensions, filtered to 250 kHz). (D) Correlation between fwhm values and bis-ANS data for two independent pores with indicated geometric parameters, pore 1 (R2 − 0.93) and pore 2 (Rz − 0.95). All data were low-pass filtered to 200 kHz. (E) Correlation between fwhm values and bis-ANS data for pore 3 (R2 = 0.04), showing the inadequate resolution of a larger pore.
