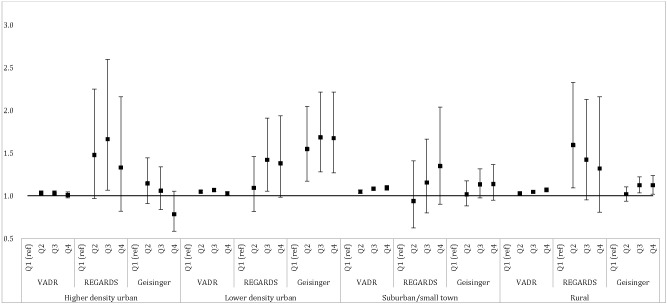
Figure 1.
Associations of NSEE (in quartiles separately derived by Diabetes LEAD Network community type so that quartiles cannot be compared across LEAD community types) with risk of new-onset T2D. Effect is presented as hazard ratio for VADR, risk ratio for REGARDS, and odds ratio for G/JHU. VADR data were adjusted for baseline age, quadratic age, race/ethnicity, sex, income/disability flag, neighborhood land-use environment, and percentages of Hispanic and Black participants. REGARDS data were adjusted for age, race, sex, income, current smoking, neighborhood land-use environment, and percentages of Hispanic and Black participants. G/JHU data were adjusted for age, sex, race/ethnicity, medical assistance, smoking, neighborhood land-use environment, percentages of Hispanic and Black participants. To address nonlinearity, the higher-density urban model included a quadratic fast-food variable and the suburban/small town model included quadratic and cubic fast-food variables. Q, quartile.

