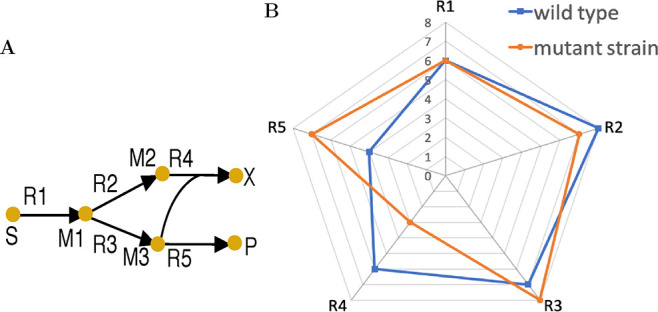
Figure 1.

Toy metabolic network (A) and flux distributions of the wild type and mutant (B). Symbols in (A) are as follows: S, carbon source; X, biomass; P, product; Mi (i = 1, 2, 3), metabolite name; Ri (i = 1,..., 5), reaction name. Each axis in (B) represents the absolute flux for a reaction.
