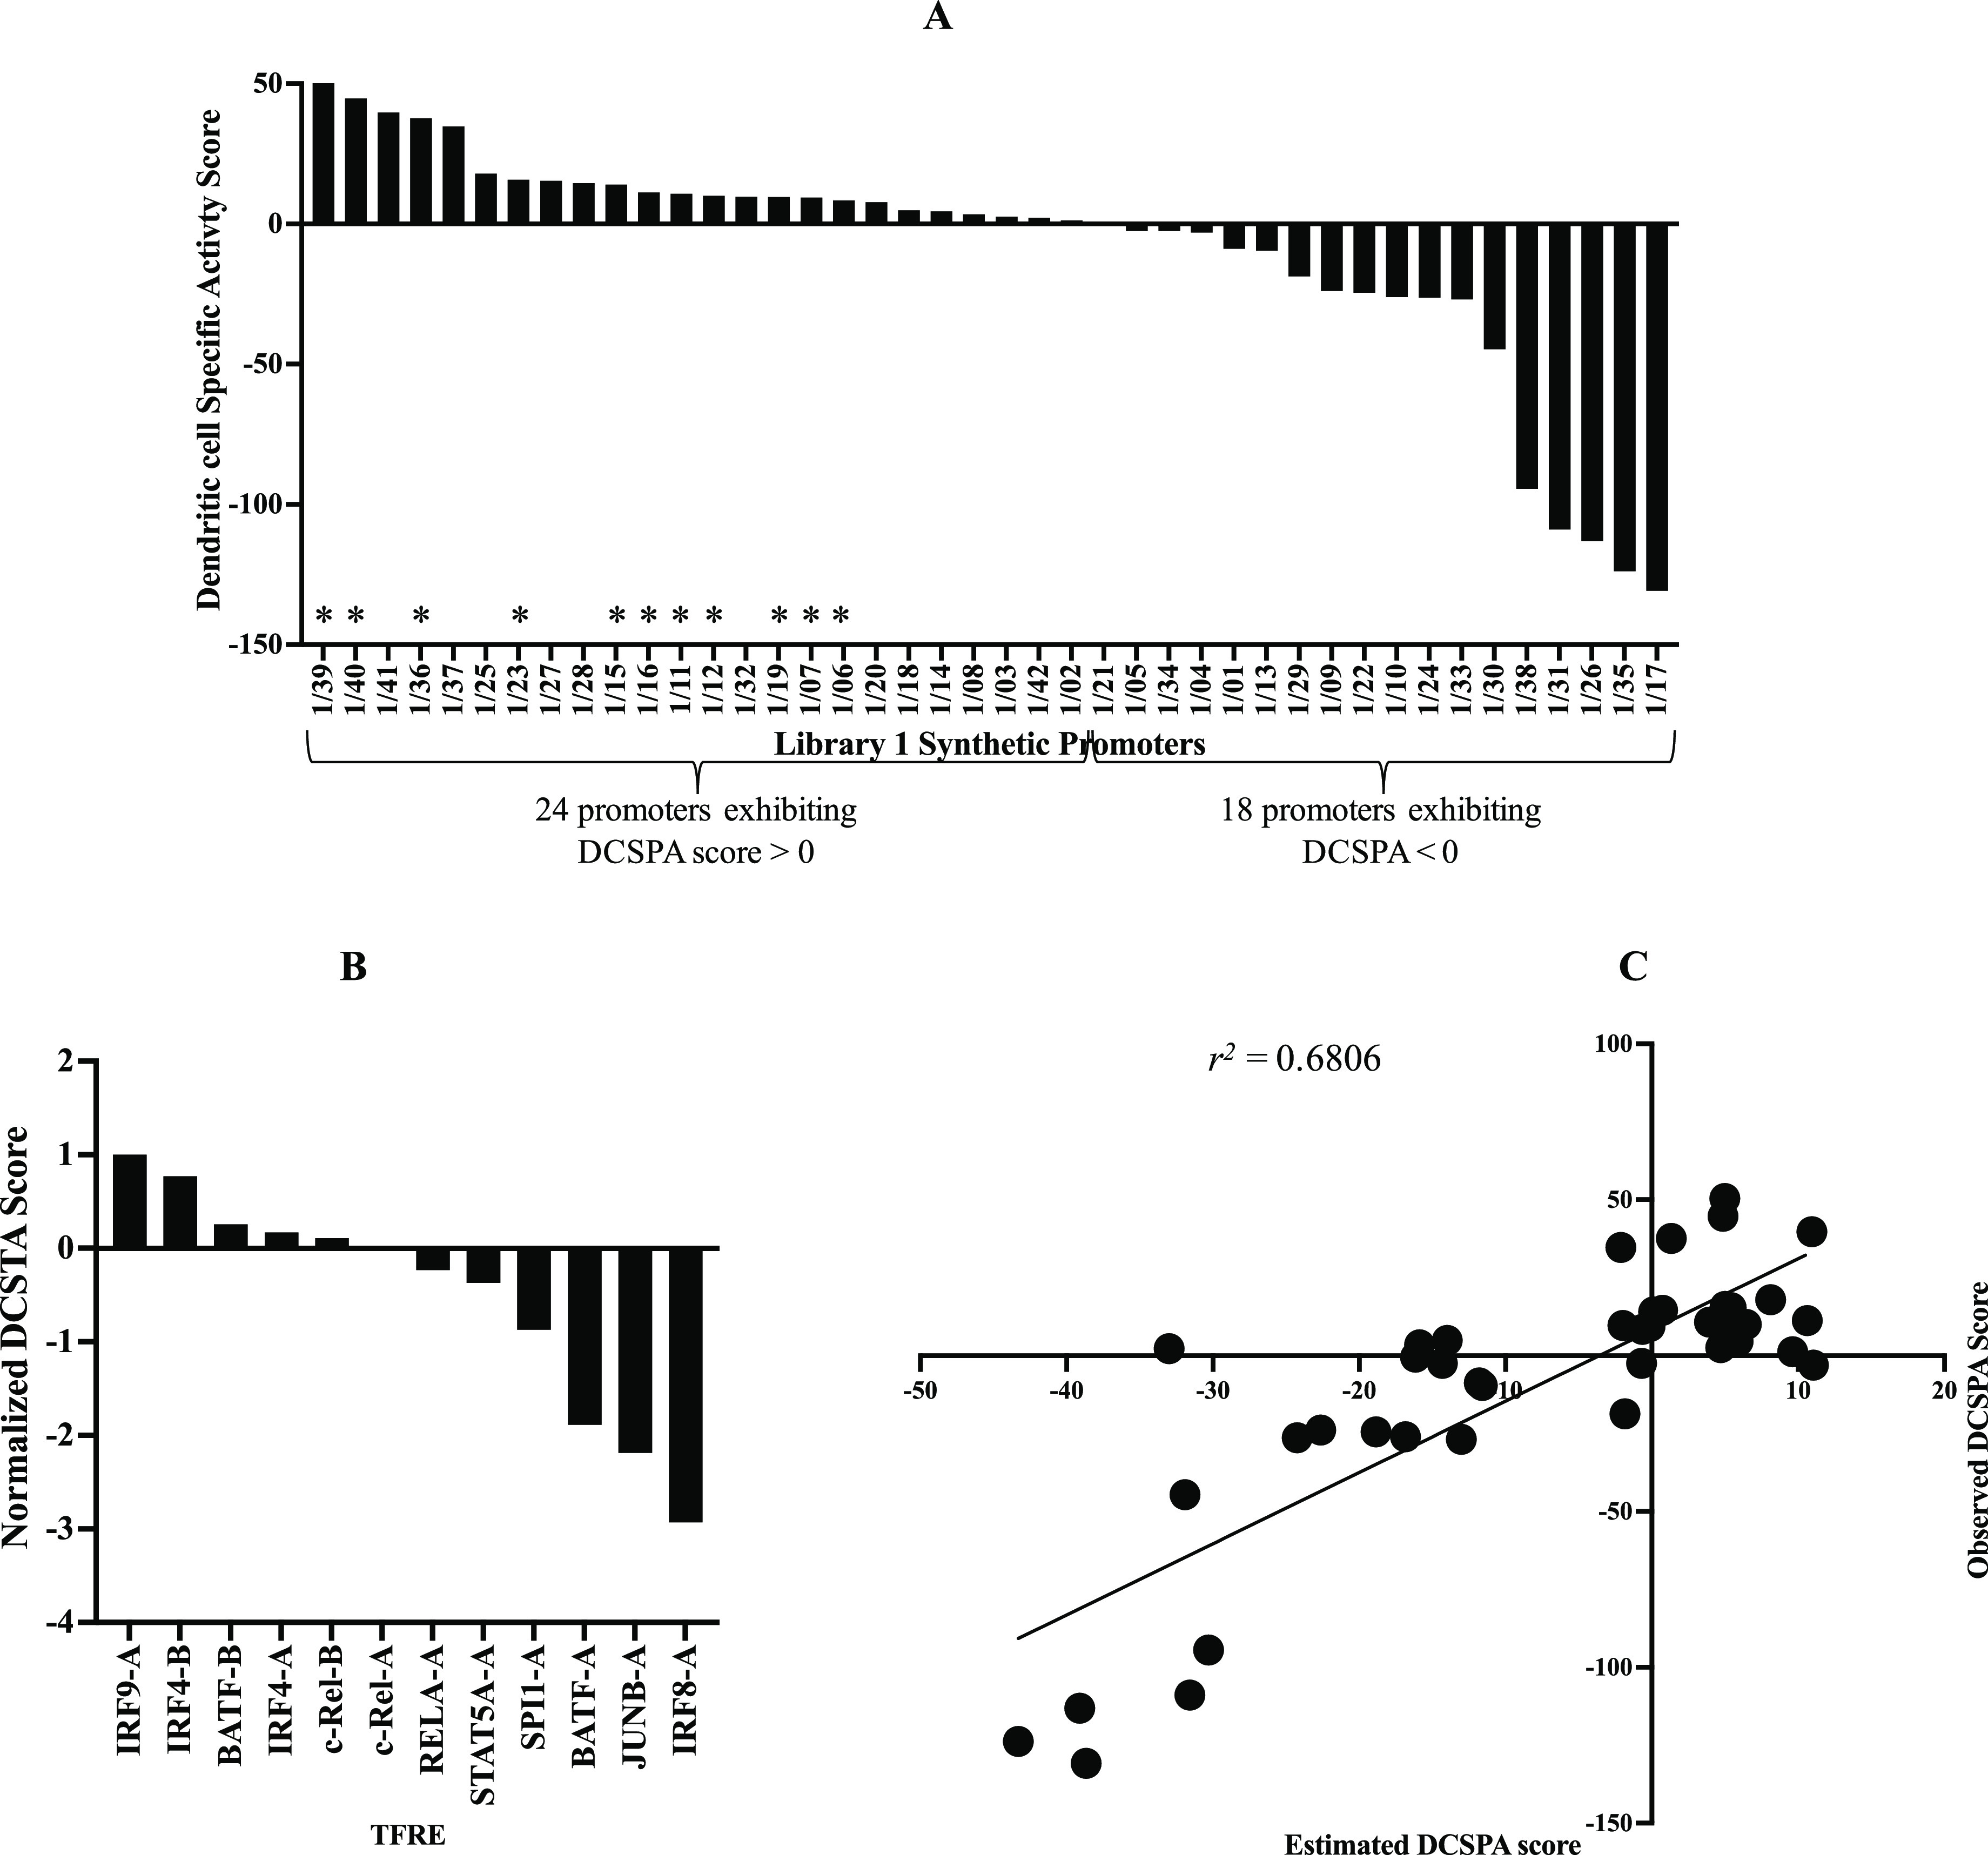
Figure 4.

(A) DCSPA score of all 42 first library promoters arranged in descending order of magnitude showing the degree to which each promoter accesses the DC-specific transcriptional landscape. 24 promoters are shown to access the DC-specific transcriptional landscape, and 14 promoters to not access a DC-specific transcriptional landscape. All 11 most DC-specific promoters (starred) exhibit positive DCSPA scores. (B) Normalized DC-specific TFRE activity score of all 12 TFREs arranged in a descending order of magnitude showing the degree of contribution of individual TFREs to DCSPA. (C) Plot of observed DCSPA score and the estimated DCSPA score. A statistically significant relationship (r2 = 0.6806) is established between the estimated DCSPA score and the observed DCSPA.
