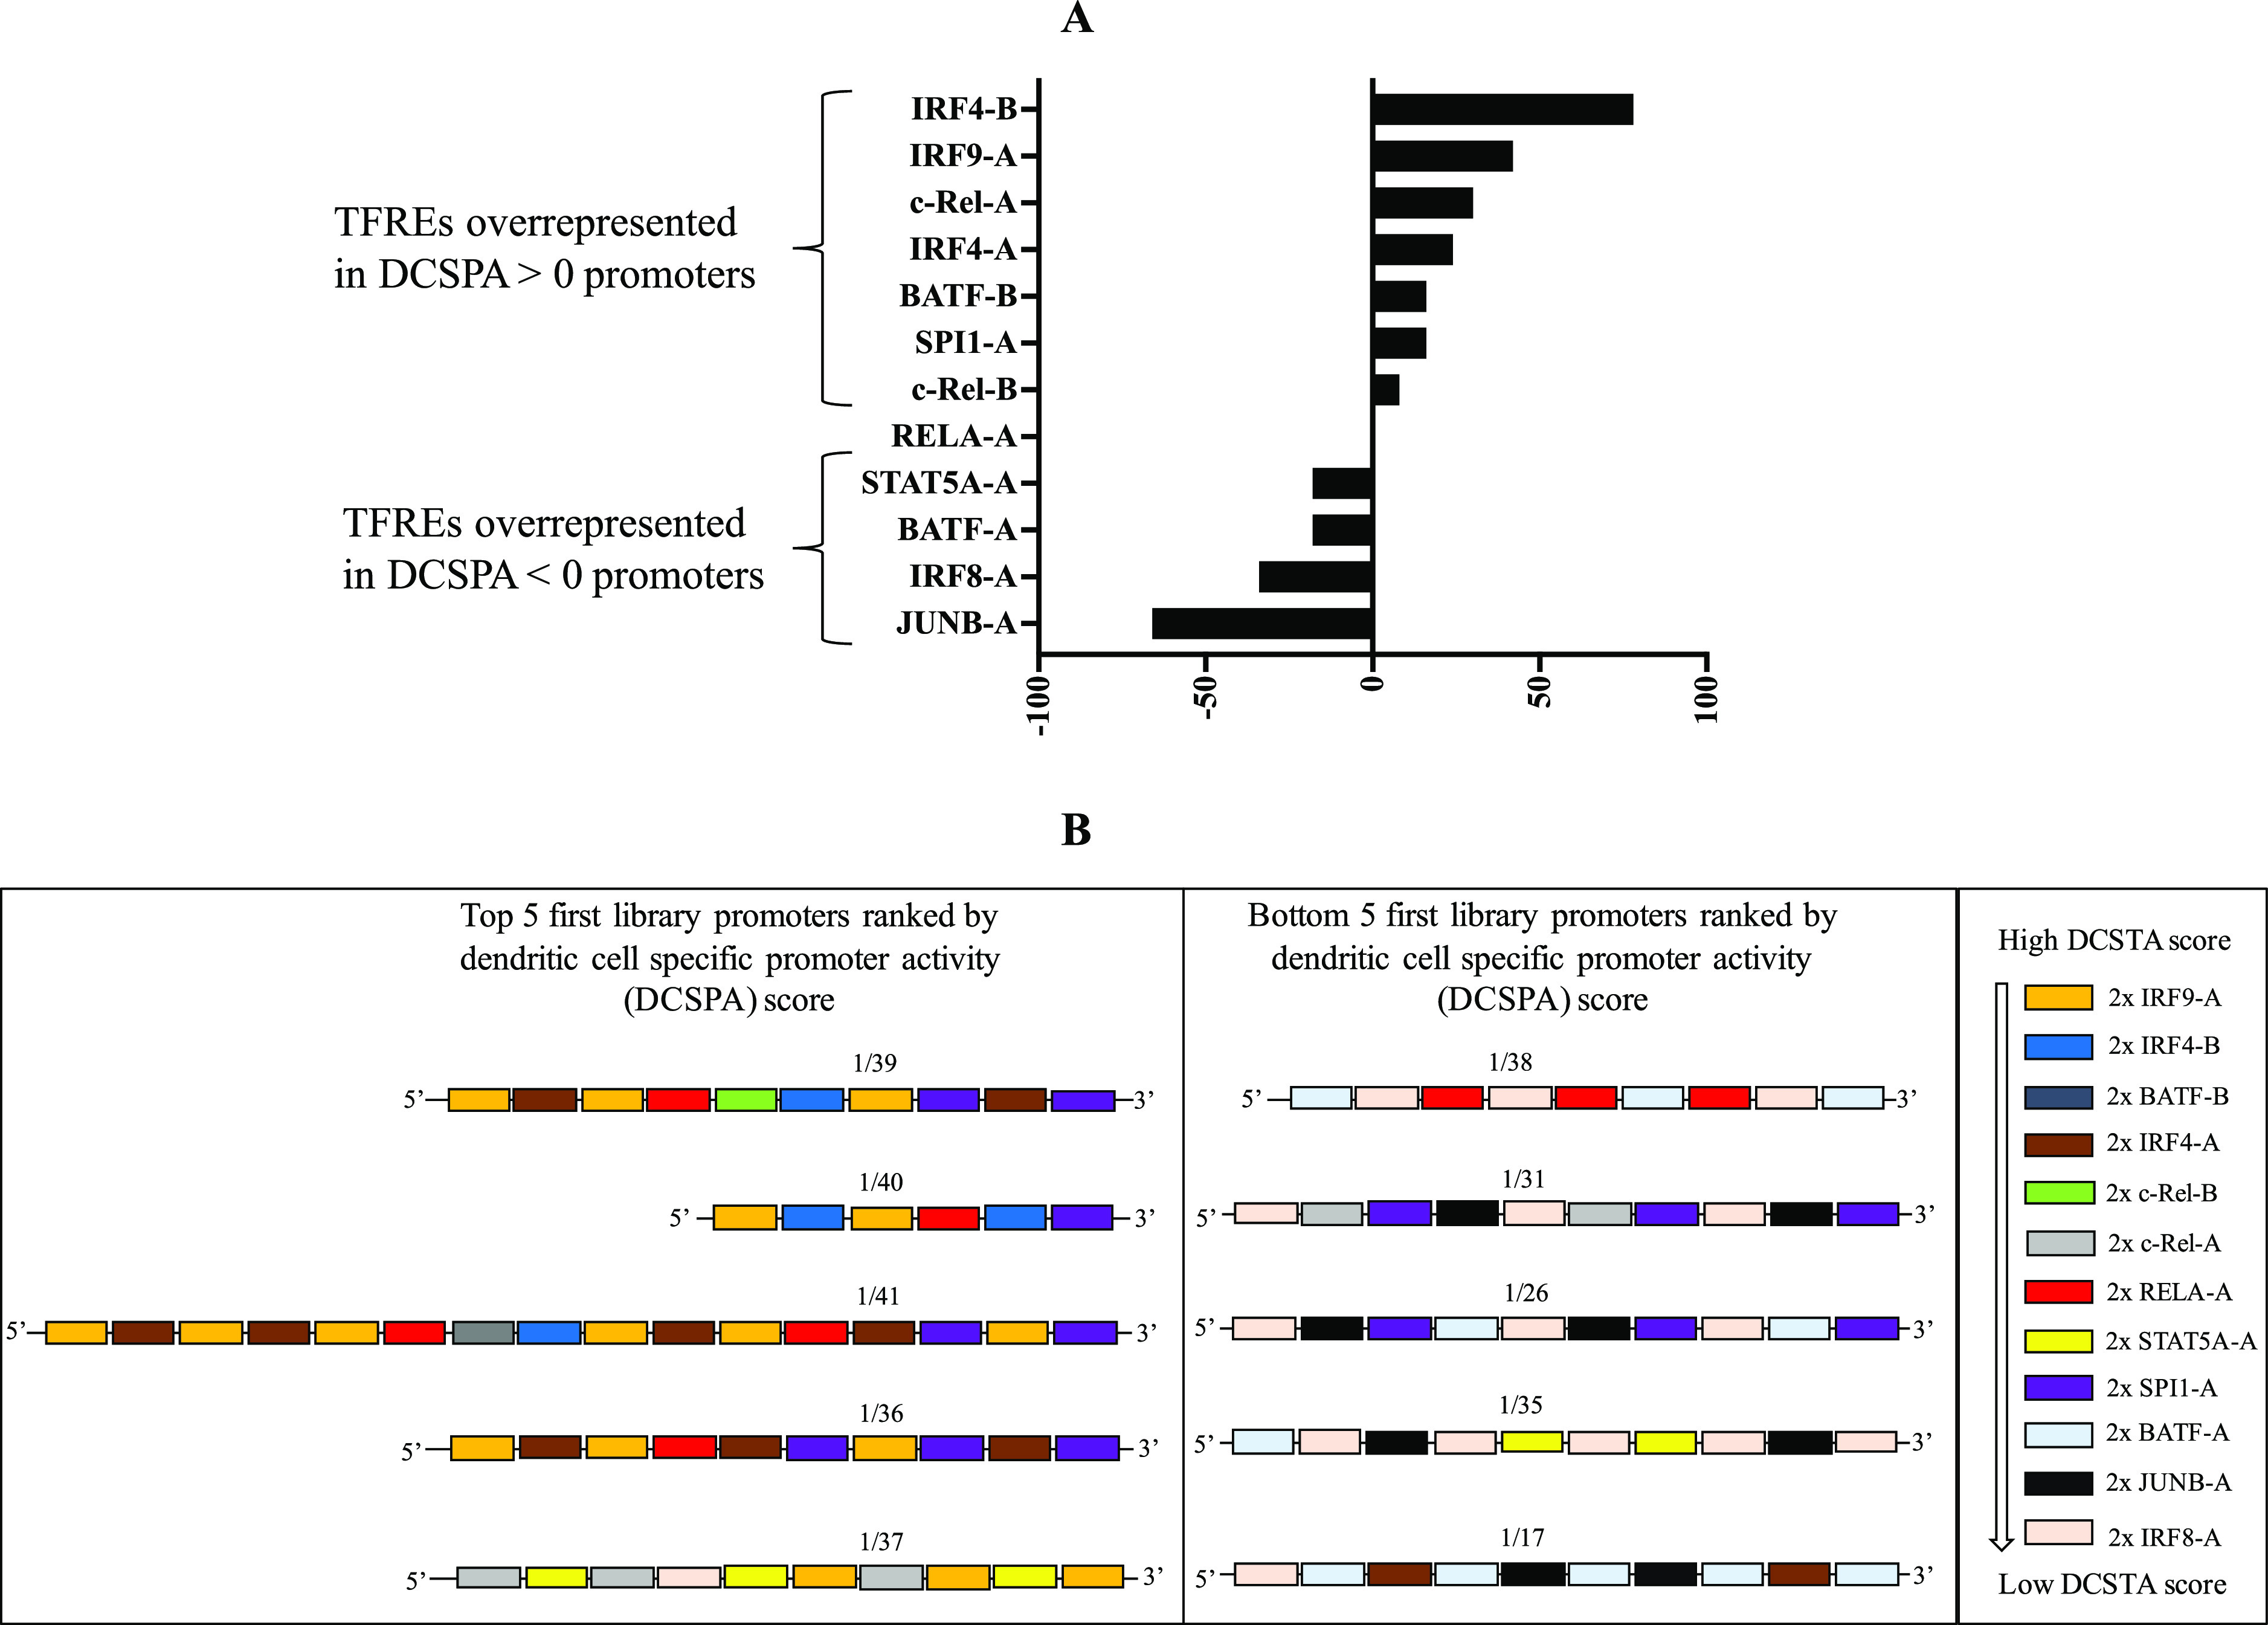
Figure 5.

(A) Differential frequency of representation of individual TFREs across first library promoters indicates that IRF4-B, IRF9-A, c-Rel-A, IRF4-A, BATF-B, SPI1-A, and c-Rel-B are relatively overrepresented across first library promoters displaying positive DCSPA scores, while STAT5A-A, BATF-A, JUNB-A, and IRF8-A are relatively overrepresented across first library promoters displaying negative DCSPA scores. (B) Schematic illustration of the architecture of the top five and bottom five first library promoters ranked by DCSPA score showing a differential representation of TFREs across both promoter categories.
