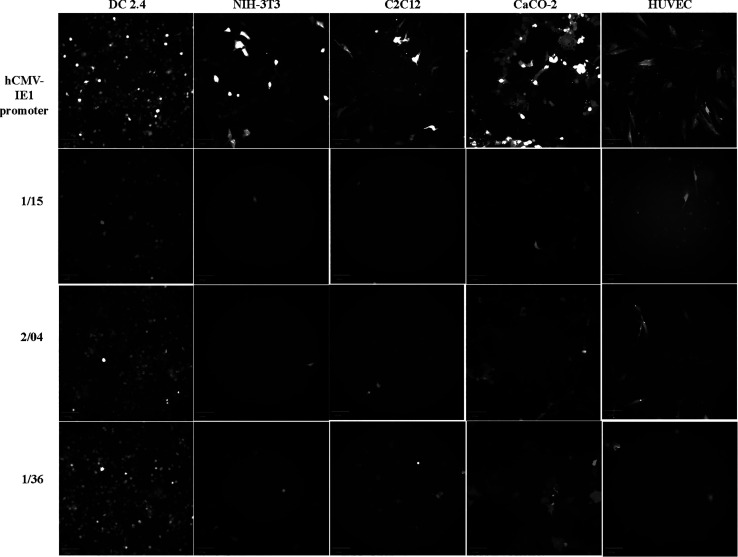
Figure 7.
Fluorescence imaging of GFP expression in the live target (DC2.4) and off-target cells (NIH-3T3, C2C12, CaCO-2, and HUVEC) under the control of weak (1/15), moderate (2/04), and strong (1/36) DC-specific synthetic promoters relative to the hCMV-IE1 promoter, using the FITC channel setting on an INCELL Analyzer 2000. Image scale—100 μm.

