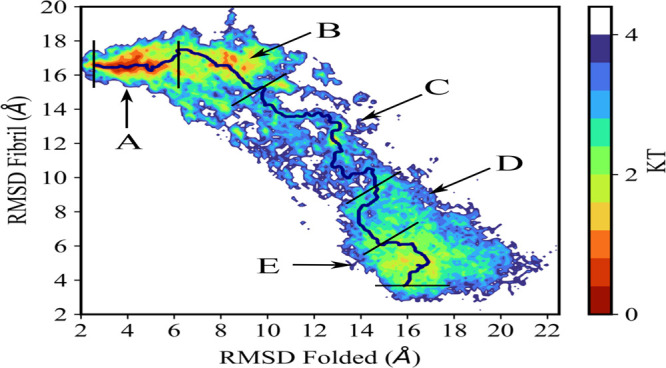
Figure 3.

Free energy landscape as obtained from RET simulations, with data taken at λ = 0, i.e., where the physical models are not biased by any Go-term. Energies are listed in units of kT. The prospective transition pathway is drawn in black, and the five regions crossed by this path are marked in capital letters.
