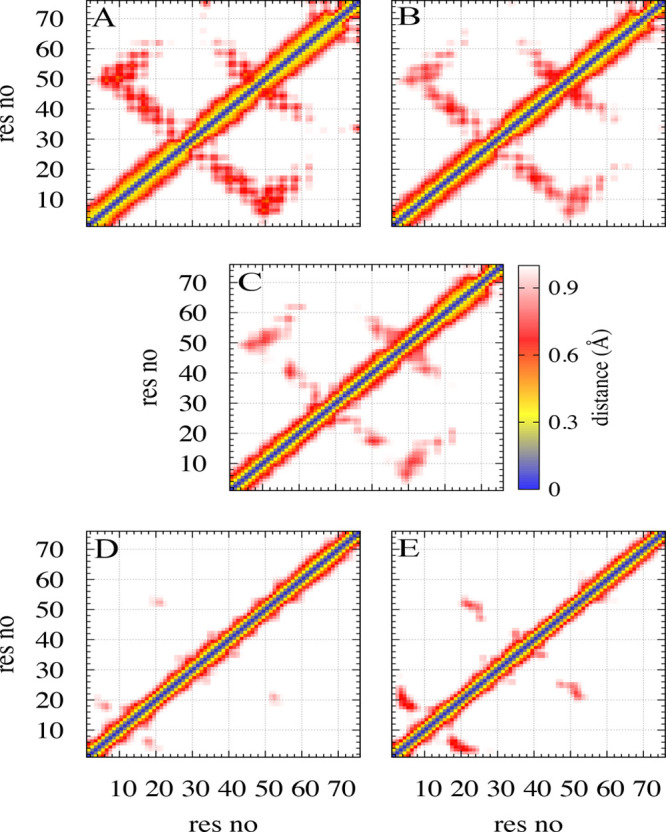
Figure 6.

Residue–residue map of the average minimal distance between heavy atoms in a pair of residues, shown for each of the five regions A, B, C, D, and E. Unlike in the transition regions B, C, and D, folded conformations dominate in region A, and fibril-like ones dominate in region E. Residue pairs whose average contact distance is more than 10 Å are excluded. Numbers on the X and Y axis mark residues, and the average distance in Å is given by the color coding shown in the middle row.
