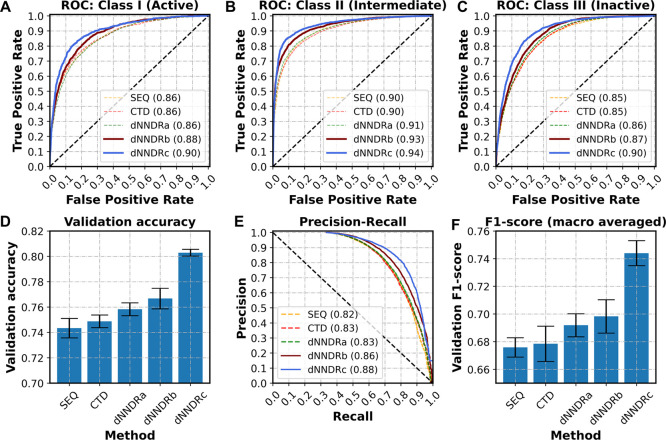
Figure 3.
Comparison of performances among all the methods under observation. ROC curves for the three classes, namely, (A) active, (B) intermediate, and (C) inactive, indicate the effectiveness of dNNDR over baseline methods in predicting the type of interaction for a given drug–target pair. (D) Validation accuracy, (E) precision-recall curves, and (F) macro-averaged F1-score also follow a similar trend and reinforce the utility of the proposed methods.

