Figure 1.

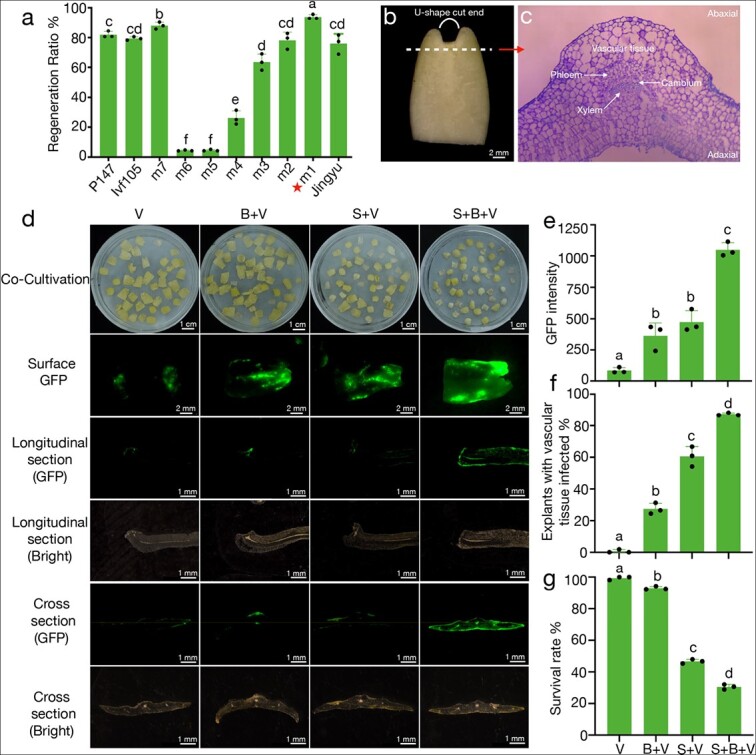
Increasing infection intensity is the key to genetic transformation of melon. (a) Shoot regeneration ratio of ten different melon varieties. For each variety, the regeneration ratio was calculated as the percentage of explants with regenerated shoots/total number of explants. The red star indicates that the highest rate was 93.8% for m1. Data are means of three replicates, and error bars indicate standard deviations. Different lowercase letters indicate significant differences (p < 0.05, Tukey’s test). (b) The cotyledon explant of melon. The curved white line represents the U-shaped cut end. The white dash represents the cross section of panel c. (c) Cross-section along the white dash of panel b, showing that the cambium cells are located in the deeper layer of vascular tissue. (d) From left to right, each column represents different infection treatments and effects. V: vacuum, B: micro-brush, S: sonication. The first line shows the cotyledon explants of melon after co-cultivation with Agrobacterium tumefaciens in the dark. From the second line to the sixth line, examination of GFP fluorescence after co-cultivation showed the region and intensity of the fluorescent signal. The third and fourth lines show the infected areas in longitudinal section. The fifth and sixth lines show the infected areas in cross-section. (e, f, and g) GFP intensity, explants with infected vascular tissue, and survival rate under four different treatments, respectively. Data are means of three replicates, and error bars indicate standard deviations. Different lowercase letters indicate significant differences (p < 0.05, Tukey’s test).
