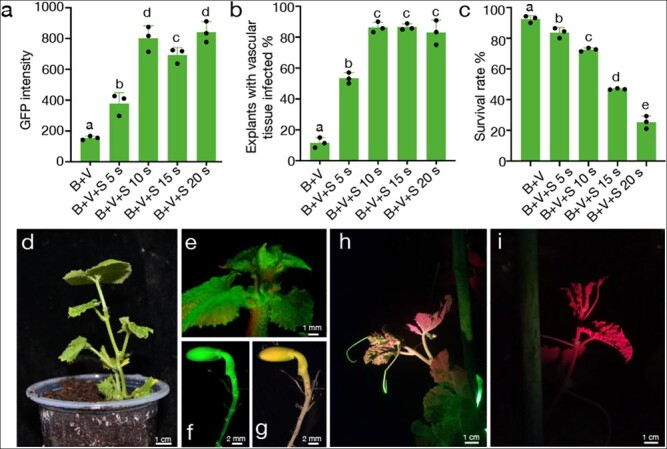
Figure 2.

The genetic transformation system of melon was established using the strategy of optimal infiltration intensity. (a, b and c) GFP intensity, explants with infected vascular tissue, and survival rate of melon m1 under five different treatments, respectively. Data are means of three replicates, and error bars indicate standard deviations. Different lowercase letters indicate significant differences (p < 0.05, Tukey’s test). (d) A regenerated transgenic T0 plant of melon was transferred to the soil. The GFP-fluorescent apical meristem (e) and seeds (f and g) of the transgenic melon T0 plant. The transgenic T1 plant (h) and WT (i) of melon under the GFP channel of the LUYOR-3415RG. Tissues appear green because of GFP expression and red because of chlorophyll autofluorescence.
