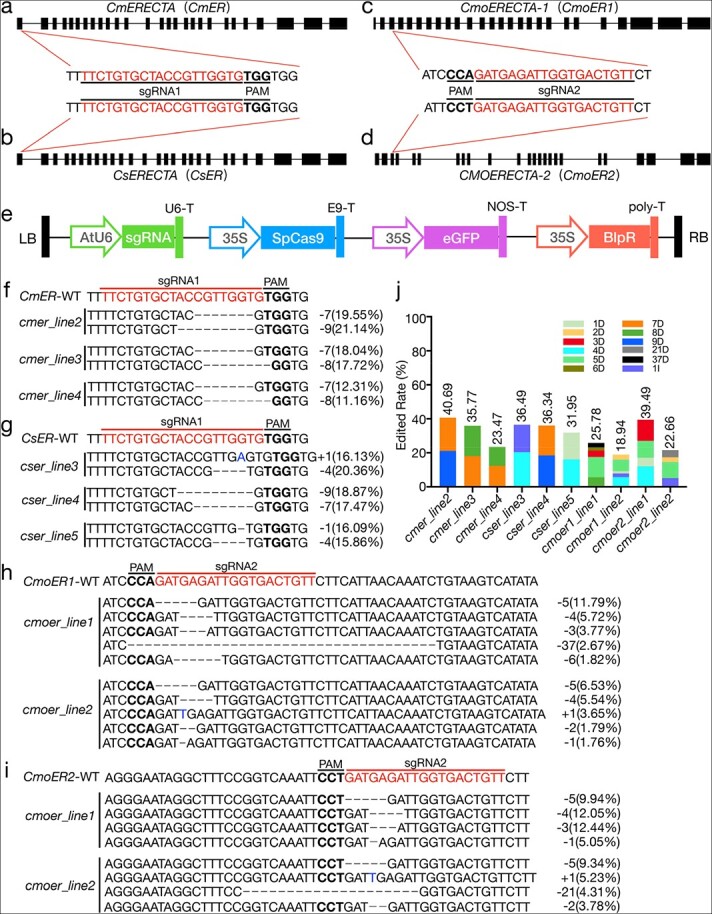
Figure 5.

Vector, sgRNA map, CRISPR/Cas9 editing target sites, and editing efficiency. (a–d) Schematic view of sgRNA target sites and editing results for the ER gene in melon, cucumber, and squash. The target sequences are highlighted in red and underlined, and the PAM sites are highlighted in bold and underlined. (e) T-DNA region of the pBSE402 vector. (f–i) Genome editing results of T0 generation plants. sgRNA and protospacer-adjacent motif (PAM) sequences are highlighted by red and bold, respectively. Black dash indicates deletion. Blue letters indicate insertion. The text on the right indicates the editing type. The numbers in parentheses represent the proportion of this editing type in the total reads. (j) The columnar stacking diagram shows the target mutation rate based on Hi-TOM analysis (reads of target mutation/total reads of target site). Different colors represent different mutation types. D indicates deletion, and I indicates insertion.
