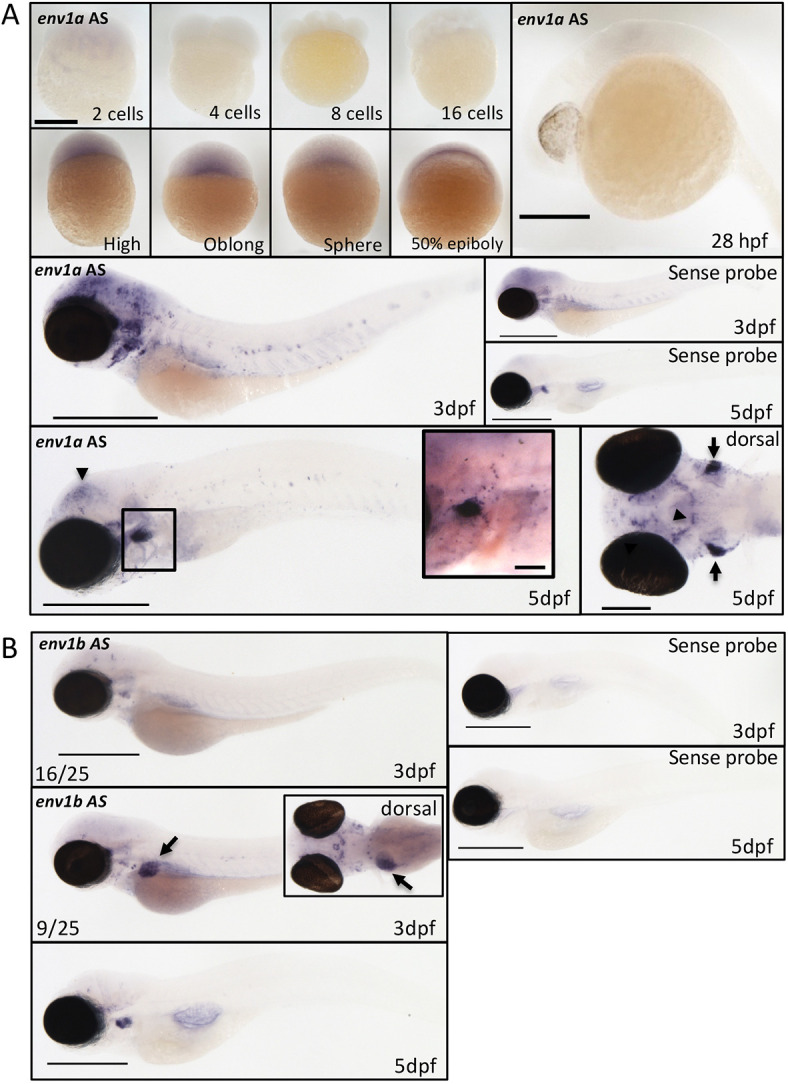
Fig. 2.

Reporter line for zferv1a recapitulates endogenous expression. (A) Expression of the envelope gene (env) of zferv1a (called env1a here) using antisense (AS) and sense in situ hybridisation RNA probes from the two-cell stage until 5 dpf (black arrowheads point to brain expression). Scale bars: 500 µm unless specified otherwise. Bottom left panel shows dorsal view of env1aAS expression in the brain (black arrowheads) and thymus (black arrows). Scale bar: 200 µm. Inset shows a magnified image of the thymus area (boxed), highlighting strong expression around the thymus with single positive cells visible in the vicinity of the thymus around the ear and alongside the branchial arches. Scale bar: 70 µm. (B) Expression of the envelope gene (env) of zferv1b (called env1b AS here) by in situ hybridisation at 3 dpf and 5 dpf. Liver expression is highlighted by black arrows. Inset shows dorsal view of the asymmetric liver expression. Scale bars: 500 µm.
