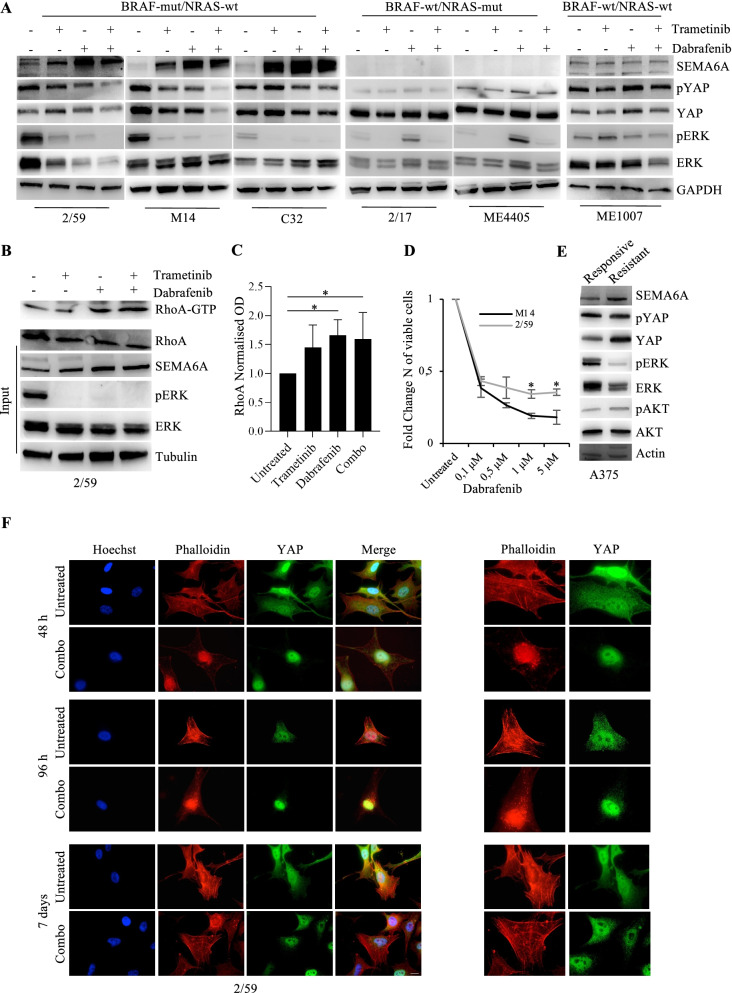
Fig. 3.
Dabrafenib, trametinib, and their combination induce SEMA6A-RhoA-YAP axis in BRAF-mut melanoma cells. A: BRAF-mut/NRAS-wt 2/59, M14 and C32, BRAF-wt/NRAS-mut 2/17 and ME4405, and BRAF-wt/NRAS-wt ME1007 cell lines were treated with 0,1 μM dabrafenib, 5 nM trametinb and their combination for 48 h. Western blot (WB) analysis of SEMA6A, phosphorylated and total YAP and ERK was performed on total cell extracts from untreated and treated cells. The anti-GAPDH antibody was used to validate equivalent amount of loaded proteins in each lane. B: WB analysis of activated RhoA (RhoA-GTP) pulled down from cell lysates and RhoA, SEMA6A, phosphorylated and total ERK on total cell extracts from untreated and treated 2/59 cells as specified. The anti-tubulin antibody was used to validate equivalent amount of loaded proteins in each lane. C: Densitometric analysis of RhoA-GTP normalized to RhoA is reported. The results are presented as mean+/− standard deviation of three independent experiments (*p < 0.05). D: 2/59 and M14 expressing high and low SEMA6A respectively were treated with different doses of dabrafenib for 48 h. The results are reported as fold change of viable cells compared to untreated cells. The results are presented as mean+/− standard deviation of three independent experiments (*p < 0.05). E: WB analysis of SEMA6A, phosphorylated and total YAP, ERK, and AKT was performed on total cell extracts from A375 cells sensitive and resistant to dabrafenib. The anti-actin antibody was used to validate equivalent amount of loaded proteins in each lane. F: BRAF-mut 2/59 cells plated on poly-l lysine coated slides were treated or not with dabrafenib+trametinib for 48 h, 96 h and 7 days, and stained with anti-YAP (green signal) and Phalloidin (red signal). The cells were counterstained with Hoechst to highlight nuclei. Scale bar 10 μm. Magnification of Phalloidin and YAP images is reported in right most panels

