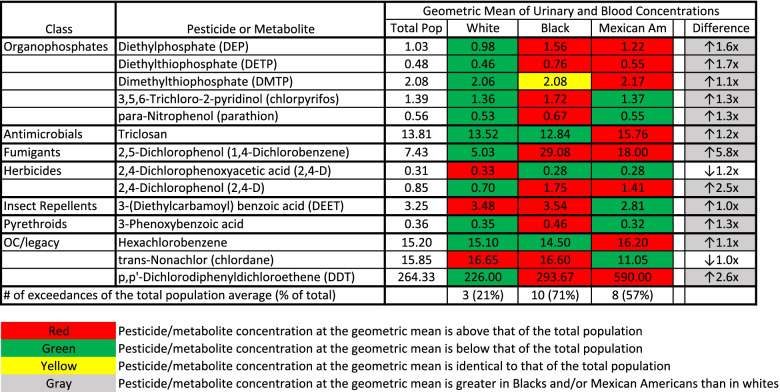
Fig. 2.
Average Urinary or Blood Pesticide/metabolite Concentrations in People of Various Demographic Groups in the USA. The first column identifies the class of the pesticide/metabolite. The second column identifies the specific pesticide/metabolite that was analyzed. The third, fourth, fifth, and sixth columns contain the geometric mean of the urinary or serum concentrations of each pesticide/metabolite for the total population (Total Pop), whites, Blacks and Mexican Americans (Mexican Am), respectively. All values are urinary concentrations (non-creatinine adjusted) in μg/L for all pesticide/metabolite classes except “OC/legacy.” For the “OC/legacy” pesticide/metabolite class, values are serum concentrations in ng/g of lipid. The last column is the fold change between the pesticide/metabolite concentration in whites and the demographic group with the highest pesticide/metabolite concentration. The last row indicates the total number (and % of total) of pesticides/metabolites for which the concentration in the demographic group exceeded that of the total population

