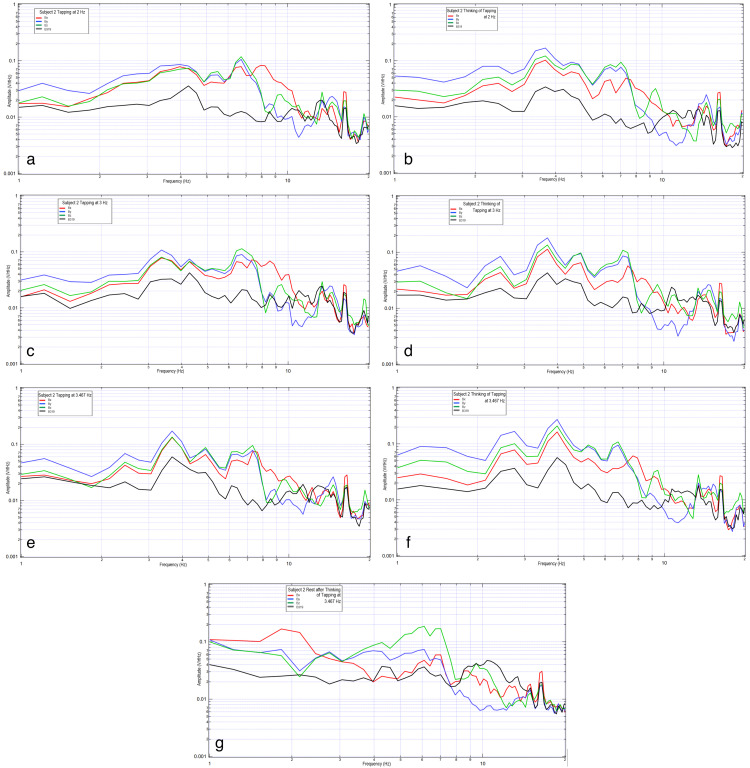
Figure 2. Comparison of a subject tapping versus thinking of tapping at 2Hz, 3Hz, and 3.467 Hz.
2a shows subject tapping at 2 Hz, 2b shows subject thinking of tapping at 2 Hz, 2c shows subject tapping at 3 Hz, 2d shows thinking of tapping at 3 Hz, 2e shows tapping at 3.467 Hz, 2f shows thinking of tapping at 3.467 Hz, and 2g shows subject at rest after thinking of tapping at 3.467 Hz. In each graph, the vertical axis is sensor outputs in the frequency domain (0.001-1 V/rtHz), and the horizontal axis is the frequency (1 to 20 Hz), both in the log scale.
The red curve is sensor Bx, the blue curve is sensor By, the green curve is sensor Bz, and the black curve is sensor B319.

