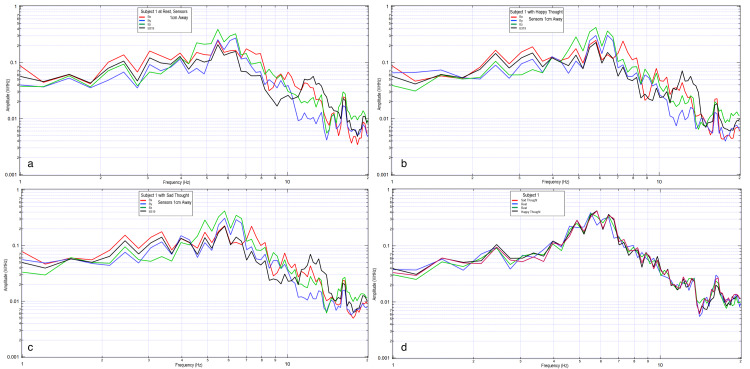
Figure 9. Comparison of brain activity EMF recorded from subject 2 with four sensors.
Subject at rest (9a), thinking of a happy thought (9b), and thinking of a sad thought (9c). The last graph (9d) is the summary of Bz sensor during two rest periods (dark blue and green) and a happy (gray) and sad (red) thought. Sensor Bz is depicted as green and blue for rest, black for happy, and red for sad.
EMF: electromagnetic field

