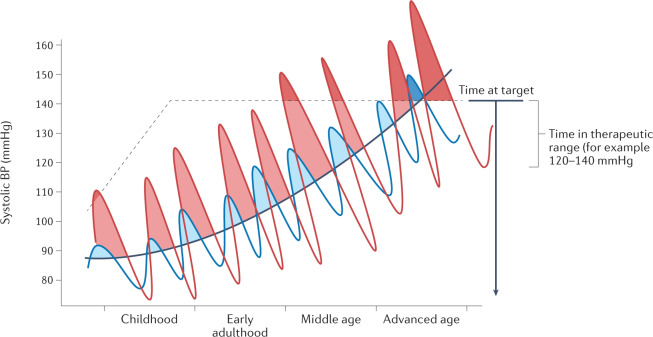
Fig. 3. The concept of time at target blood pressure levels.
As blood pressure (BP) levels increase with age, the systolic BP of two individuals (depicted by the red and blue lines) might present similar average levels (black line), but owing to a greater BP load, the individual with the BP depicted by the red line will have a greater risk of cardiovascular disease over their lifetime. Adapted with permission from ref.26, Wolters Kluwer.

