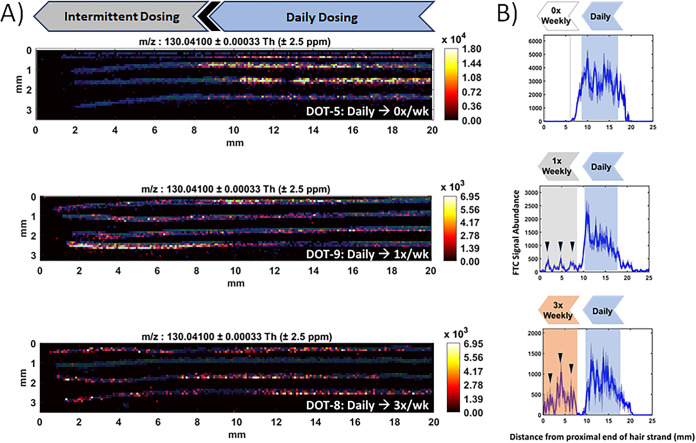
FIG 1.
(A) Representative IR-MALDESI MSI FTC ion maps showing drug accumulation associated with daily dosing and each of the three intermittent dosing groups (from top: 3 times per week, once per week, and 0 times per week, respectively). FTC signal abundance is represented by a color scale increasing in concentration from regions of dark red/black to regions of orange/yellow. Also visible is the overlaid IR-MALDESI response to an endogenous ion homogeneously present in the hair strands (blue) that clearly defines the shape, orientation, and length of the individual strands to assist in seeing regions of hair growth where FTC was not measured. (B) Composite longitudinal profiles of FTC and 95% confidence intervals (CI) from individual hair strands shown in panel A. Shaded areas reflect periods of hair growth within the profile attributed to active dosing. Arrows in the intermittent-dosing region highlight repeating weekly patterns measured by IR-MALDESI.

