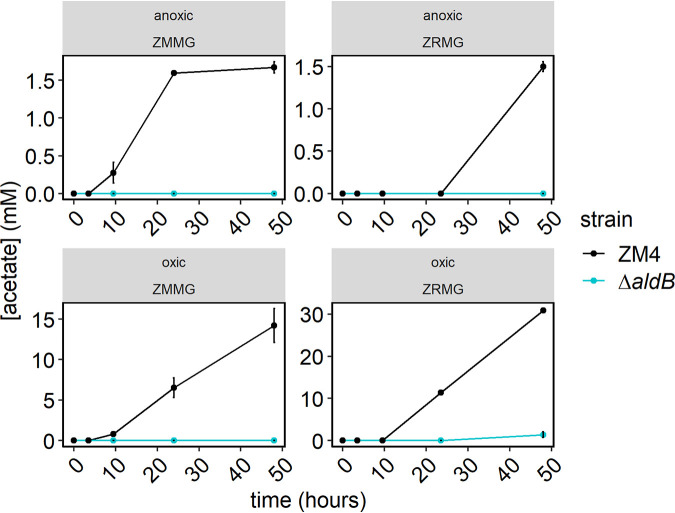
FIG 3.
Acetate production by Z. mobilis ZM4 WT (black) and the ΔaldB strain (blue). Samples from cultures used in Fig. 2 were centrifuged, and clear supernatants were analyzed by HPLC as described in Materials and Methods. Acetate concentrations were calculated from standard curves. Points represent the average of 3 biological replicates, and error bars represent standard error. Note that y axis scales differ across panels.

