
FIG. 1.
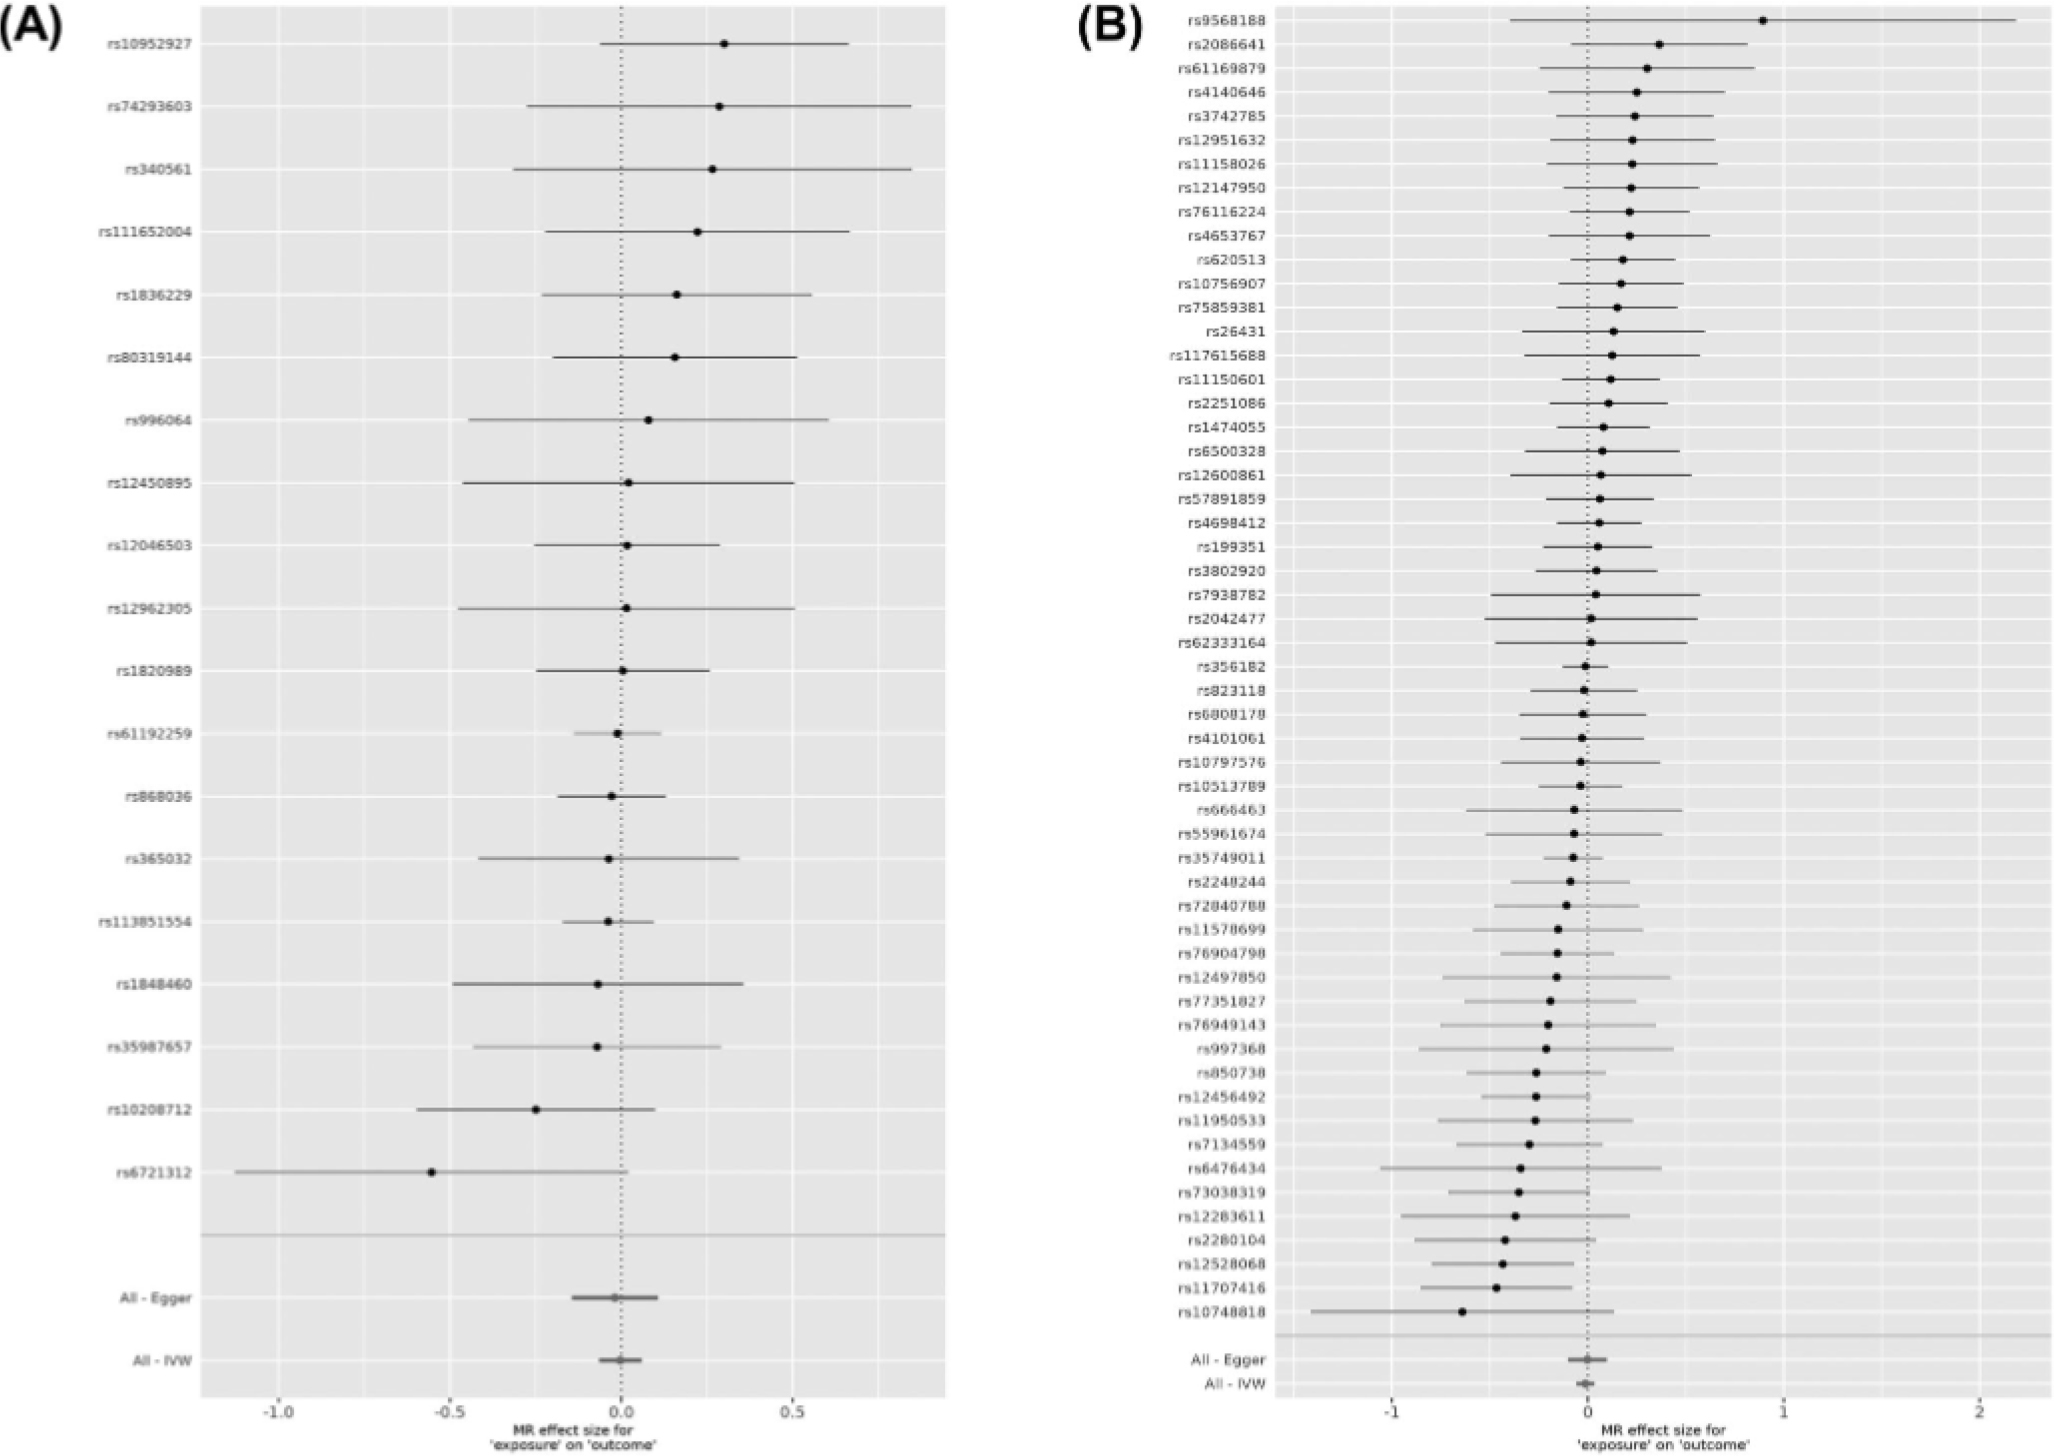
Forest plots showing results from the Mendelian randomization study to evaluate the potential causal relationships between RLS and PD. (A) Forest plot showing point estimates of RLS as an exposure on PD (outcome). In total, 19 index SNPs were left after excluding the pleiotropic SNPs to construct instrument variables. The black dots represent the causal estimate (b = log odds ratio) of each SNP on the risk of PD. Red dots represent the causal estimate when combining all SNPs together, using MR Egger and IVW methods. Horizontal lines denote 95% CI. (B) Forest plot showing point estimates of PD as an exposure on RLS (outcome). The instrument variables were constructed by 55 index SNPs. The black dots represent the causal estimate (b, the log odds ratio) of each SNP on the risk of RLS. Red dots represent the causal estimate when combining all SNPs together, using MR Egger and IVW methods. Horizontal lines denote 95% CI.