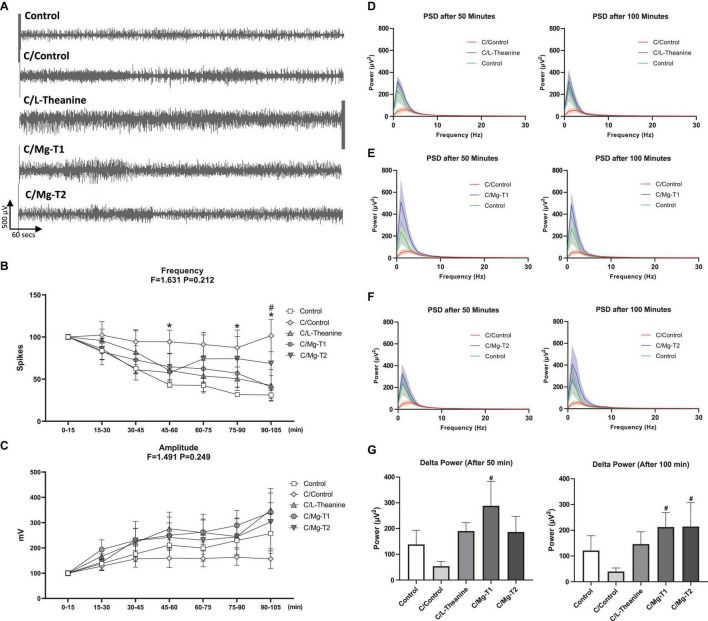
FIGURE 2.
Effect of L-theanine and Mg-L-theanine compounds on brain electrical activity. Representative ECoG recordings for each group (A) and analyses of spike frequency (B) and amplitude (C) on ECoG. Values are represented as mean ± SEM for each group, n = 6. Symbols indicate significance by Fisher’s LSD as *p < 0.05 between Control and C/Control, #p < 0.05 between C/Control and C/Mg-T1 groups. Frequency-power graphs of L-theanine (D), Mg-T1 (E), and Mg-T2 (F) at 50th and 100th minutes for 0–30 Hz range show restoration of slow brain waves after caffeine-induced decline which is then separately graphed for comparison of delta power between groups (G). Average of the 1200 FFTs (10 min following 50th and 100th minutes) were calculated for each animal. #p < 0.05 compared to C/Control group. All values are represented as mean ± SEM.

