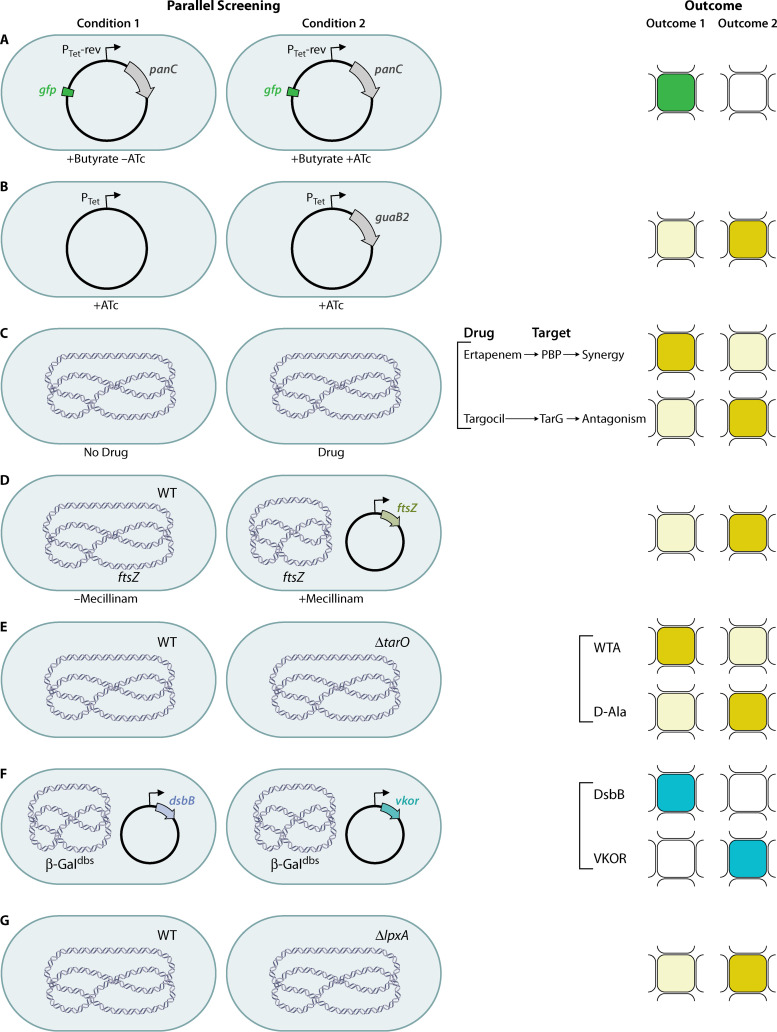
FIG 3.
Conditions and outcomes of TB and parallel WCSs. (a) Downregulation of PanC using a regulatable promoter and growth using a fatty acid as a carbon source to increase sensitivity; a fluorescent protein allows measurement of growth to find inhibitors of pantothenate biosynthesis. (b) Upregulation of GuaB2 to make bacteria more resistant to inhibitors of purine biosynthesis. (c) Sensitization of bacteria by adding a drug with a known target to find synergistic inhibitors (top) or antagonists (bottom). (d) Synthetic lethality assay to reverse the lethality of Rod inhibition by overexpression of FtsZ. WT, wild-type. (e) Synthetic lethality assay with a ΔtarO mutant to find inhibitors in late steps of WTA synthesis (top) or d-alanylation of LTA and WTA (bottom). (f) Comparison of two nonhomologous disulfide-bond-forming proteins that catalyze the same step of the pathway to find inhibitors of one (top) or the other (bottom) using β-Galdbs. (g) Synthetic lethality assay with a ΔlpxA mutant that is more resistant to inhibitors of late steps in LPS biogenesis. The cell shape is depicted as shown for simplicity, but shapes vary for the bacterial taxons discussed. Chromosomal DNA is depicted as blue DNA material in the center of the bacterial cell. Plasmid DNA is depicted as a circle. Pale mustard indicates no growth, dark mustard indicates growth, green indicates fluorescence, blue indicates active β-galactosidase, and white indicates no fluorescence or inactive β-galactosidase.

