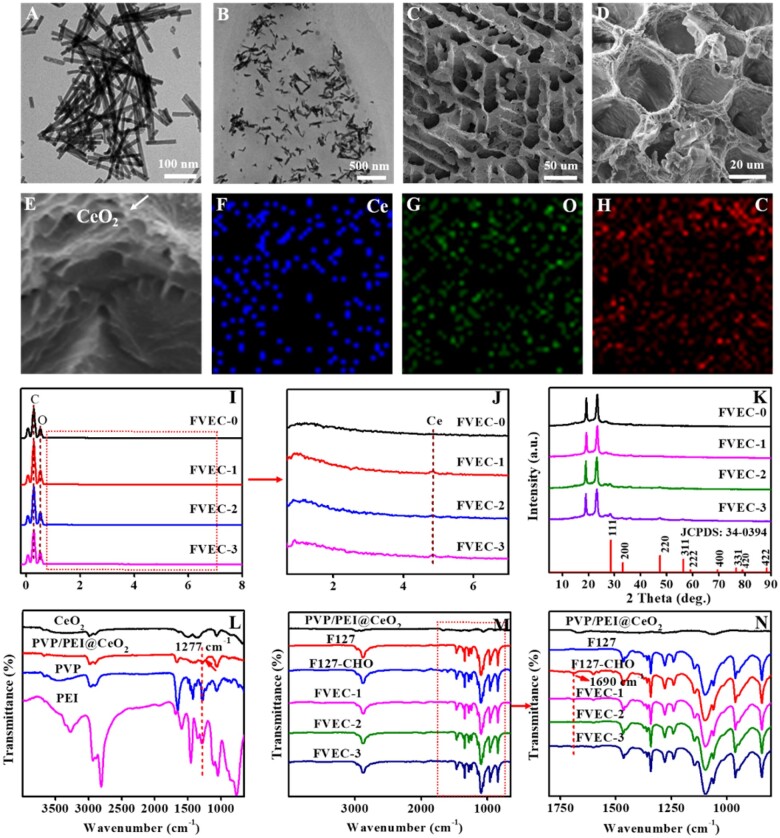
Figure 2.
Physicochemical structure characterizations. (A) TEM images of PVP/PEI@CeO2; (B) TEM images of nanocomposite hydrogel; (C–E) SEM images of nanocomposite hydrogel; (F–H) element mapping of nanocomposite hydrogel; (I–G) EDS spectra; (K) XRD patterns; and (L–M) FT-IR spectra; (N) Enlarged view of the part in the red dashed box in M.

