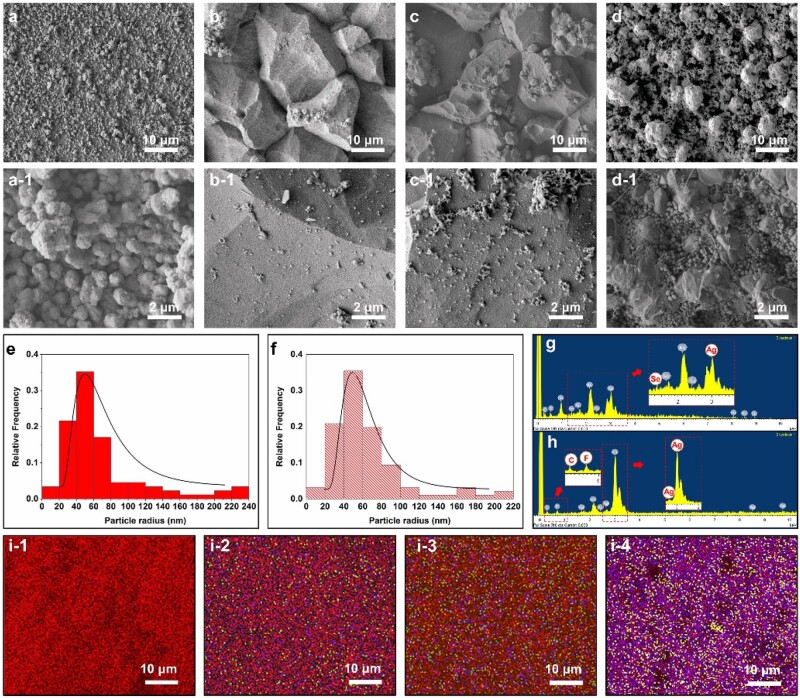
Figure 2.
Typical SEM images of (a) Ag coatings; (b) Ag–Se (50 ml/l) coatings; (c) Ag–Se (100 ml/l) coatings and (d) Ag–PTFE coatings; (e and f) size distributions of SeNPs in Ag–Se (50 ml/l) and Ag–Se (100 ml/l) coatings; typical EDX analysis of (g) Ag–Se coatings and (h) Ag–PTFE coatings; (i1–i4) EDX mappings of SEM images (a)–(d) (element colour: Ag, red; C, yellow; Se, green; F, blue)

