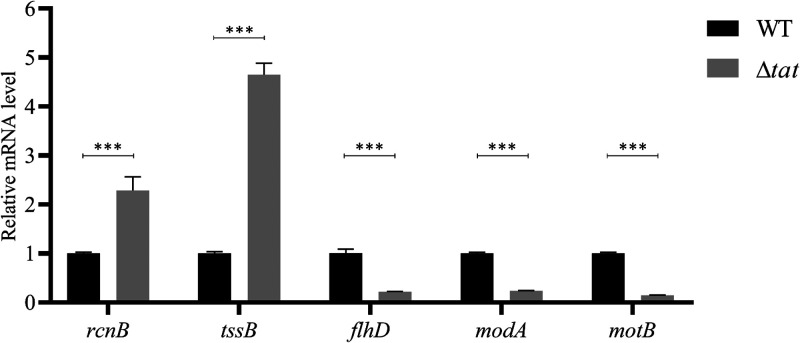
FIG 6.
RT-qPCR analysis of the Rcs regulons. Total RNA was extracted from cells of each indicated strain grown to the mid-log phase. Genomic DNA was removed, and cDNA was synthesized and was used as the template for qPCR with a QuantStudio 6 Flex fluorescence quantitative PCR instrument. The expression level of the tested gene was calculated using the 2−ΔΔCT method and normalized to the housekeeping gene gapA. Data are displayed as the geometric mean ± SEM. Statistical significance between the two groups was analyzed using Student’s t test. ***, P < 0.001.

