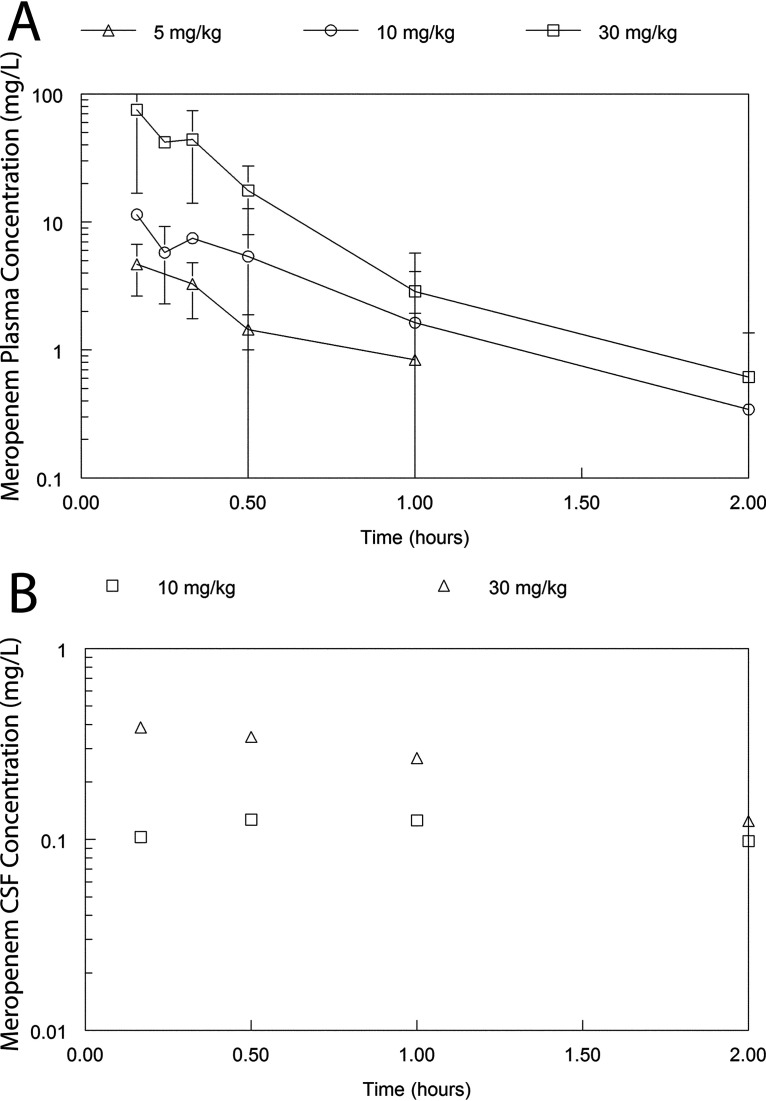
FIG 2.
Concentration-time profiles of meropenem in the plasma and CSF of rabbits receiving 5, 10, and 30 mg/kg as a single dose. Panel A shows the plasma PK from all rabbits (n = 36). Panel B (n = 8) shows the CSF concentrations in a dedicated satellite experiment to estimate the percentage partitioning of meropenem from plasma into the CSF. In panel A, the data are the mean ± the standard deviation. In panel B, each observation is obtained from a single rabbit.

