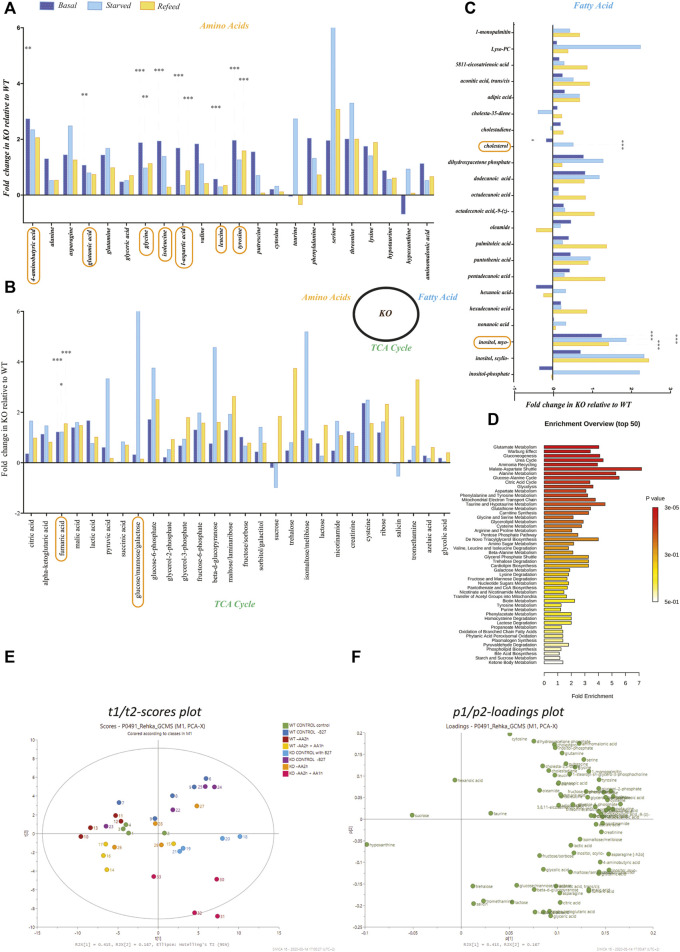
FIGURE 3.
Metabolomics profiling of amino acids, fatty acids, and TCA/glycolysis intermediates in KO primary cortex cells. Metabolomics was performed on WT and KO PCCs using GCMS-MS. (A–C) Fold change of amino acids in KO compared to WT primary cortical neurons for (A) amino acids, (B) TCA cycle metabolites, and (C) metabolites involved in the fatty acid synthesis. Statistical analyses were performed, and significantly changed molecules were marked after performing a two-way ANOVA and Bonferroni post-tests (*p < 0.05, **p < 0.01, ***p < 0.001). (D) Metaboanylate pathway enrichment of detected metabolites between KO and WT PCCs. Here, we only show metabolite pathways with at least three metabolites in the set. (E,F) PCA plots based on the metabolomics profile of KO and WT PCCs. (E) Two dimensional t1/t2-scores plot and (F) loadings plot.

