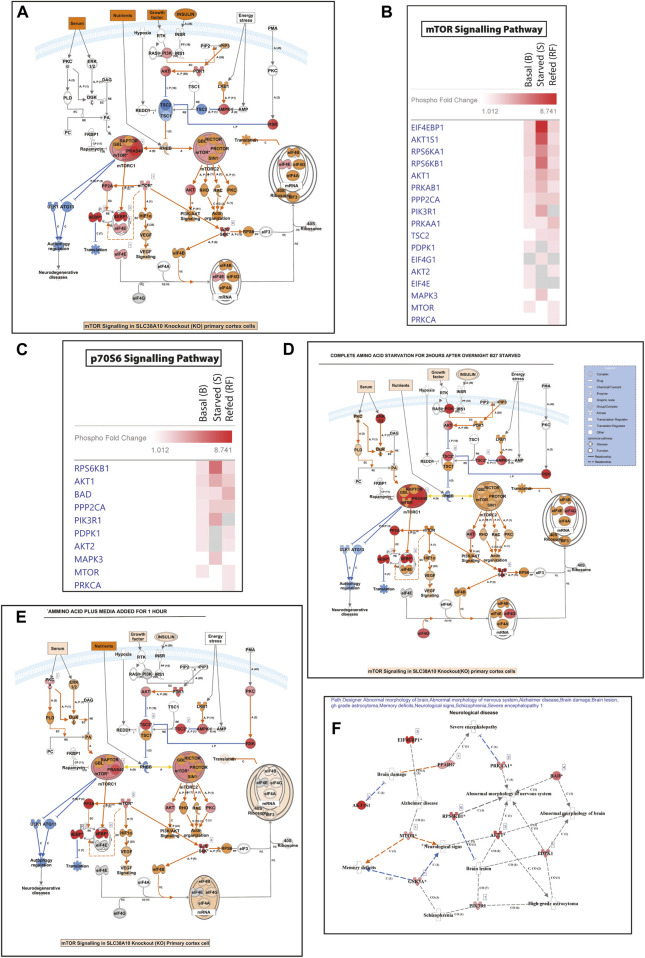
FIGURE 6.
The response in mTOR pathway and amino acid regualtion following SLC38A10 knockout. Complete transcriptomic data and changed gene list subjected to IPA software analysis. (A) Regulation in the mTOR pathway in response to SLC38A10 knockout in Basal condition, blue symbols indicate down regulation and red symbols up regulation. (B) Heatmap describing changes in transcript levels from the mTOR pathway during Basal, Starved and Refed conditions. (C) Heatmap describing changes in transcript levels from the p70S6 pathway during Basal, Starved and Refed conditions. (D) Regulation in the mTOR pathway in response to SLC38A10 knockout in Starved condition, blue symbols indicate down regulation and red symbols up regulation. (E) Regulation in the mTOR pathway in response to SLC38A10 knockout in Refed condition, blue symbols indicate down regulation and red symbols up regulation. (F) Neurological diseases predicted by Path Designer, in response to SLC38A10 knockout.

